Written by Steven Hansen
As you know, imports are subtracted from GDP. Partially due to the dollar strength – exports are falling and imports are marginally growing. The end result is that the trade deficit grows, and GDP declines.

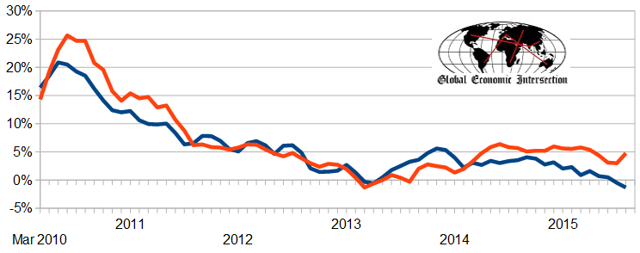
This past week, I did an analysis of trade data. The unadjusted three month rolling average value of exports decelerated month-over-month – but imports accelerated. Export rolling averages are now in contraction year-over-year.
Historically, import goods growth has positive implications for the economy – and the seasonally adjusted goods and services imports were reported up month-over-month. Econintersect analysis shows unadjusted goods (not including services) growth acceleration of 2.5% month-over-month (unadjusted data).The rate of growth 3 month trend is accelerating.
Inflation Adjusted But Not Seasonally Adjusted Year-over-Year 3 Month Rolling Average – Goods Export (blue line) and Goods Import Excluding Oil (red line)
z trade2.PNG
The decrease in seasonally adjusted exports was generally across the board except for consumer and capital goods which increased. Import increase was due to consumer and capital goods.
The market expected (from Bloomberg) a trade deficit of – $50.2 B to – $41.0 billion (consensus – $48.6 billion deficit) and the seasonally adjusted headline deficit from US Census came in at – $48.3 billion.
It should be noted that oil imports were down 17 million barrels from last month, and up 4 million barrels from one year ago.
The data in this series is noisy, and it is better to use the rolling averages to make sense of the trends.
The headline data is seasonally adjusted ( but not adjusted for inflation)d. Econintersect analysis is based on the unadjusted data, removes services (as little historical information exists to correlate the data to economic activity), and adjusts for inflation. (Also, there is some question whether this services portion of export/import data is valid in real time because of data gathering concerns.) Backing out services from import and exports shows results graphically as follows:
Inflation Adjusted But Not Seasonally Adjusted Year-over-Year Change Goods Export (blue line), Goods Import Excluding Oil (red line), and Goods Import with Oil (yellow line)
z trade1.PNG
Growing exports is a sign of an expanding global economy (or at least a sign of growing competitiveness).
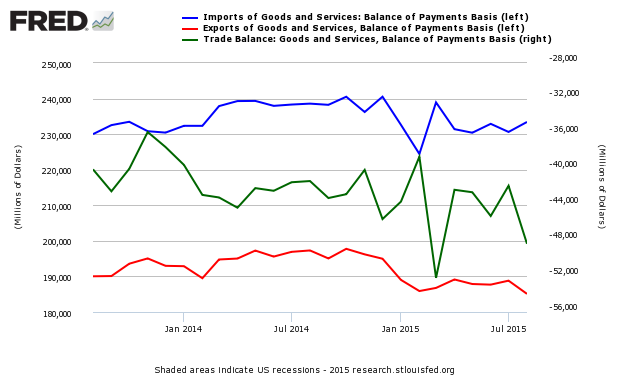
Seasonally Adjusted Total Imports (blue line), Exports (red line) and Trade Balance (green line)

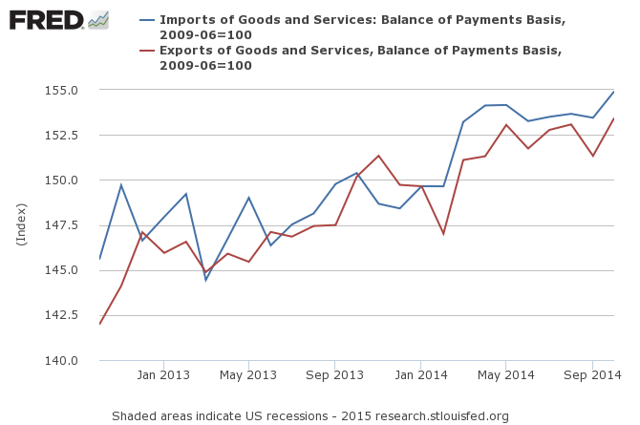
Indexing the data to the end of the recession, here is a look at the relative growth of imports and exports using current dollars as the basis for the index.
Seasonally Adjusted Total Imports (blue line) and Exports (red line) indexed to the End of Recession
Econintersect is most concerned with imports as there is a clear recession link to import contraction. Adjusting for cost inflation allows apples-to-apples comparisons in equal value dollars between periods. The graph below uses seasonally adjusted data.
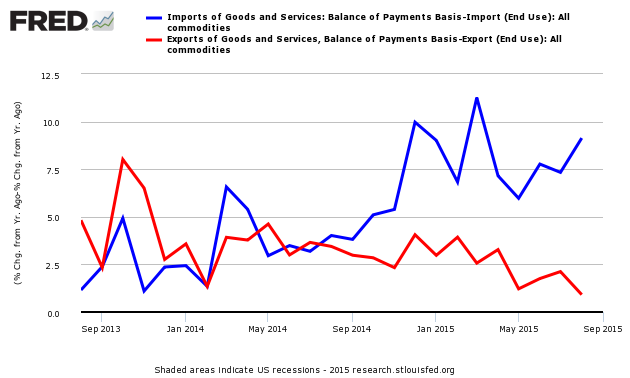
Seasonally and Inflation Adjusted Year-over-Year Change Imports (blue line) and Exports (red line)

Note: In general this is a rear view look at the economy – however, imports do have a forward vision of up to three months ahead of expected economic activity. One would think this could be a “yellow flag” for the economybecause the trend (blue line) is slightly down since late 2014. Econintersect will continue to monitor.
>>>>> Scroll down to view and make comments


