


by Congressional Budget Office
Each year, after the President releases his budget request, CBO analyzes the proposals in that request. Using its own economic projections and estimating procedures, CBO projects what the federal budget would look like over the next 10 years if the President’s proposals were adopted. CBO usually provides that information in two reports. The first examines the proposals’ direct effects on the budget; the second, which takes more time to prepare, shows the effects that the proposals would have on the economy and how those macroeconomic effects would, in turn, feed back into the budget.

As this second report explains, CBO estimates that, under the President’s proposals, the nation’s real (inflation-adjusted) gross national product (GNP) would be 0.4 percent higher, on average, during the 2016 – 2020 period, and 1.7 percent higher during the 2021 – 2025 period, than under current law. After incorporating the proposals’ macroeconomic feedback into the budget, CBO estimates that deficits under the President’s proposals would be $1.4 trillion smaller during the 2016 – 2025 period than in CBO’s baseline, which is a projection of the paths that federal revenues and spending would take over the next decade if current laws generally remained unchanged. The inclusion of the macroeconomic feedback has changed the estimated deficits under the President’s proposals only slightly from those that CBO estimated in its first report; changes in law that have occurred since the release of that report have changed the estimated deficits more significantly.
What Did CBO Previously Report About the President’s 2016 Budget?
CBO and the staff of the Joint Committee on Taxation (JCT) estimated in the first report (which was published on March 12) that deficits under the President’s proposals would total $6.0 trillion between 2016 and 2025, $1.2 trillion less than the deficits in CBO’s baseline. In each of the years from 2016 through 2018, the deficit would equal 2.0 percent or 2.1 percent of gross domestic product (GDP), and it would then increase to an average of 2.9 percent during the second half of the 10-year projection period. Under what was then current law, deficits would have been larger – starting at 2.3 percent to 2.4 percent of GDP in the next few years and then rising to 3.8 percent in 2025.
CBO’s first report about the President’s proposals typically does not include macroeconomic feedback. This year, however, a proposal related to immigration would affect the economy more directly than Presidential proposals usually would – by increasing the size of the labor force and changing the legal status of some current workers – and the feedback from that increase would result in significantly higher receipts from income and payroll taxes. Therefore, this year’s version of the first report included that feedback, as did CBO’s cost estimate for similar immigration legislation that was proposed in 2013.
What Does CBO Now Report About the President’s 2016 Budget?
This second report shows all of the effects that the President’s proposals would have on the economy and the feedback of those macroeconomic effects into the budget (rather than just some of the feedback effects of the immigration proposal). Over 10 years, deficits would differ by less than $40 billion from those estimated in the first report, and they would be almost identical as a percentage of GDP, rising from 2.1 percent in 2016 to 2.9 percent in 2025 (see figure below).
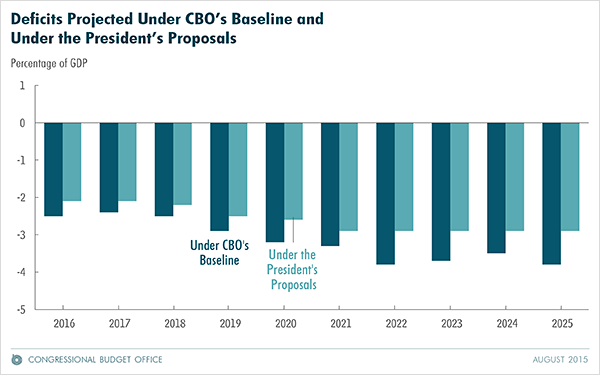
However, mostly because CBO’s baseline has been adjusted for this report to account for recent legislation, the agency now estimates that from 2016 through 2025, the President’s proposals would make deficits $1.4 trillion smaller than they are in the baseline – rather than $1.2 trillion smaller, as the first report estimated (see table below). After the first report was released, the Medicare Access and CHIP Reauthorization Act of 2015 was enacted. That law supersedes a proposal in the President’s budget to increase Medicare’s payment rates for physicians; therefore, in the current analysis, CBO included its effects in the projection of the deficit under current law, rather than including them as part of the President’s proposals. In CBO’s first report, the President’s proposal regarding those payment rates increased projected deficits by a total of about $168 billion from 2016 through 2025; in this second report, incorporating the effects of the law into CBO’s baseline (rather than treating it as a proposal by the President) increased the net savings attributable to the President’s budget by the same amount.
| Projected Deficits | ||||
| Trillions of Dollars, by Fiscal Year | ||||
| 2016-2020 | 2021-2025 | 2016-2025 | ||
| Deficits Under CBO’s March 2015 Baselinea | -2.8 | -4.6 | -7.4 | |
| Deficits Under the President’s Proposals | ||||
| With some macroeconomic feedbackb | -2.3 | -3.7 | -6.0 | |
| With all macroeconomic feedbackc | -2.4 | -3.6 | -6.0 | |
| a. | These baseline projections have been adjusted for the subsequent enactment of the Medicare Access and CHIP Reauthorization Act of 2015. Projected deficits under the unadjusted March 2015 baseline totaled $7.2 trillion over the 2016 – 2025 period. | |||
| b. | These are the estimates provided in the March 2015 analysis of the budgetary effects of the President’s proposals, adjusted for the subsequent enactment of the Medicare Access and CHIP Reauthorization Act of 2015. See Congressional Budget Office, An Analysis of the President’s 2016 Budget (March 2015). | |||
| c. | These estimates include macroeconomic feedback that was not included in CBO’s March 2015 analysis. | |||
CBO estimates that the additional macroeconomic effects analyzed in this second report would not significantly alter the net budgetary impact of the President’s proposals over the 2016 – 2025 period because their two most important influences on the budget would largely offset one another. On the one hand, the smaller deficits under the President’s budget would raise national saving, investment, and output in the long run; that higher output would generate more tax revenue. On the other hand, the workers added to the labor force under the President’s immigration proposal would increase the ratio of labor to capital, raising the rate of return on capital and therefore raising interest rates throughout the economy; those higher interest rates would raise federal borrowing rates and thus federal interest payments.
All told, under the President’s proposals, the nation’s real GNP would be 0.4 percent higher, on average, during the 2016 – 2020 period and 1.7 percent higher during the 2021 – 2025 period than under current law, CBO estimates (see figure below). Employing different estimates of certain key factors, the agency projects that the increase in GNP would probably be between 0.2 percent and 0.5 percent over the 2016 – 2020 period and between 1.1 percent and 2.3 percent over the 2021 – 2025 period. Those ranges reflect some aspects of the uncertainty of the proposals’ macroeconomic effects – including uncertainty about the effect of changes in aggregate demand on output, the effect of marginal tax rates on the supply of labor, and the effect of increased immigration on total factor productivity (the efficiency with which labor and capital are used to produce goods and services). However, many other aspects of the economic and budgetary projections are uncertain, and actual outcomes could lie outside the ranges of probable outcomes estimated by CBO.

GNP per person would be lower after 2016 under the President’s proposals than under current law, primarily because of the immigration-related increase in the size of the population.5 According to CBO’s analysis, the President’s proposals would reduce per capita GNP by about 0.5 percent over the 2016 – 2020 period, on average, and by about 0.7 percent over the 2020 – 2025 period.
>>>>> Scroll down to view and make comments


