by Zillow
The decision whether to buy a home is difficult. It’s not just the many costs to consider – transaction costs, maintenance, property taxes and homeowners insurance, for starters – but also how those costs might be offset by tax benefits and growing equity. And there’s always alternatives to consider, too: How high are rents? If you’re not using your money as a down payment, what are you doing with it? If you were to invest that money instead, what would that do for your wealth relative to home equity growth?

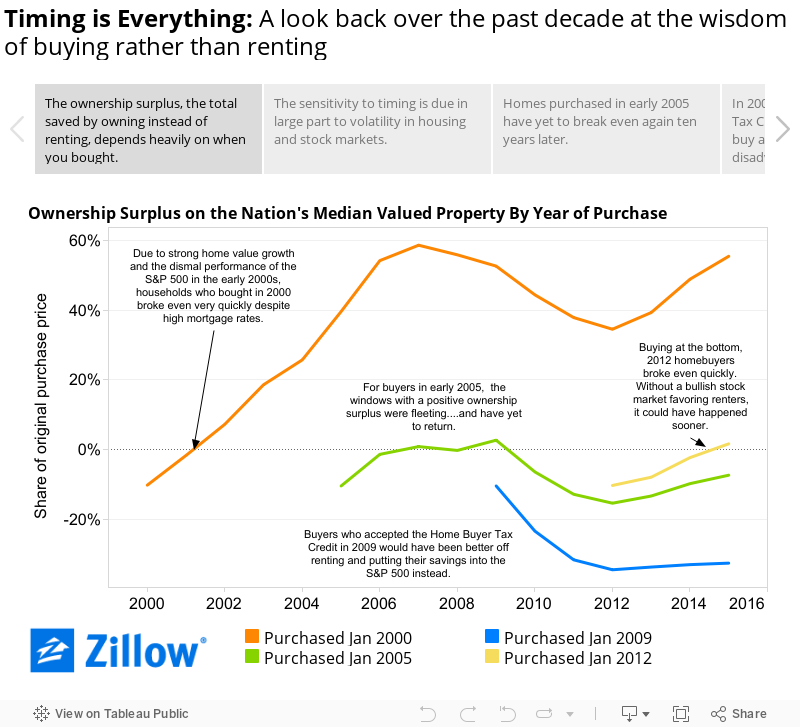
These factors and more are baked into Zillow’s Breakeven Horizon, which is the length of time you’ll need to live in a property for it to have been more financially advantageous to buy it instead of renting it and investing elsewhere. After breaking even, you’ll begin saving relative to renting, earning what we call an “ownership surplus” (see below for a more detailed definition).
Lessons from the Past
The Breakeven Horizon uses simple assumptions about how local housing and national stock markets will evolve in the future. Much is unknown, of course, but even simple assumptions are powerful. Stronger expected home value growth, for example, can shrink the Breakeven Horizon considerably and make buying a home more advantageous, more quickly. On the other hand, more robust performance in the stock market, coupled with weaker home value growth, can conspire to lengthen the Breakeven Horizon and make renting a better option.
Zillow examined Breakeven Horizons and ownership surpluses (or lingering ownership deficits) earned by home buyers over the last 15 years. Timing and market conditions play a critical role. At what point buyers purchased their home has a big impact on how quickly they have – or haven’t – broken even.
Methodology
Ownership surplus: The savings earned by a household since the original purchase by buying the property instead of renting and investing the original down payment and any other avoided costs of buying in the S&P 500. The ownership surplus is estimated as the difference between the accumulating net costs of renting, and the accumulating net costs of homeownership associated with the median valued property (single-family residences, condos and co-ops).
Accumulating net cost of homeownership: The annual costs of ownership are offset by equity growth and tax benefits. These net costs are summed from the beginning of the household’s purchase, and include:
- Home value appreciation, estimated using the Zillow Home Value Index.
- Transaction costs: 3 percent of home value at purchase, and 8 percent at sale.
- Mortgage payments: We assume a 30-year, fixed-rate mortgage on the median valued home, purchased with a 20 percent down payment and at the prevailing mortgage rate [1].
- Property taxes: We assume 1 percent of contemporaneous home value, annually.
- Maintenance and renovation expenses: Together, these are assumed to be 1 percent of home value at purchase, then growing annually with inflation.
- Homeowners insurance: Assumed to be 0.5 percent of home value, annually.
- Tax benefit: A homeowner can deduct interest payments and local property taxes from federal income. We assume a tax rate of 25 percent and use historical standard deduction amounts to estimate the tax benefit from owning.
- Opportunity cost: The interest you could have earned by investing the difference in out-of-pocket costs above and beyond renting, like the down payment, in the S&P 500 instead of buying a home.
Accumulating net cost of renting: The costs of renting summed from the beginning of the household’s lease.
- We assume annual rent increases according to the Zillow Rent Index, chained back to 2000 using changes in reported rent from the decennial census and American Community Surveys.
- Renter’s insurance: Assumed to be 1.32 percent of annual rent.


