Written by John Lounsbury
The United States has progressed from a largely agricultural nation to, through a predominance of industrializatio, and on to the consumer goods and services supply economy of the recent decades. Throughout its 230-year history, this economic progression has seen an almost incessant increase in the average population density on the land.

Please share this article – Go to very top of page, right hand side, for social media buttons.
The graph below from Statista shows the population density of the United States of America from 1790 to 2019. In 2019, the population density was approximately 92.9 residents per square mile of land area.
From Statista:
Population density has been tracked for over two hundred years in the United States. Over the last two centuries, the number of people living in the United States per square mile has grown from 4.5 in 1790 to 87.4 in 2010. After examining the data in detail, it becomes clear that a major population increase started around 1870. Population density was roughly 11 at the time and has doubled in the last century. Since then, population density grew by about 16 percent each decade. Population density doubled in 1900, and grew in total by around 800 percent until 2010.
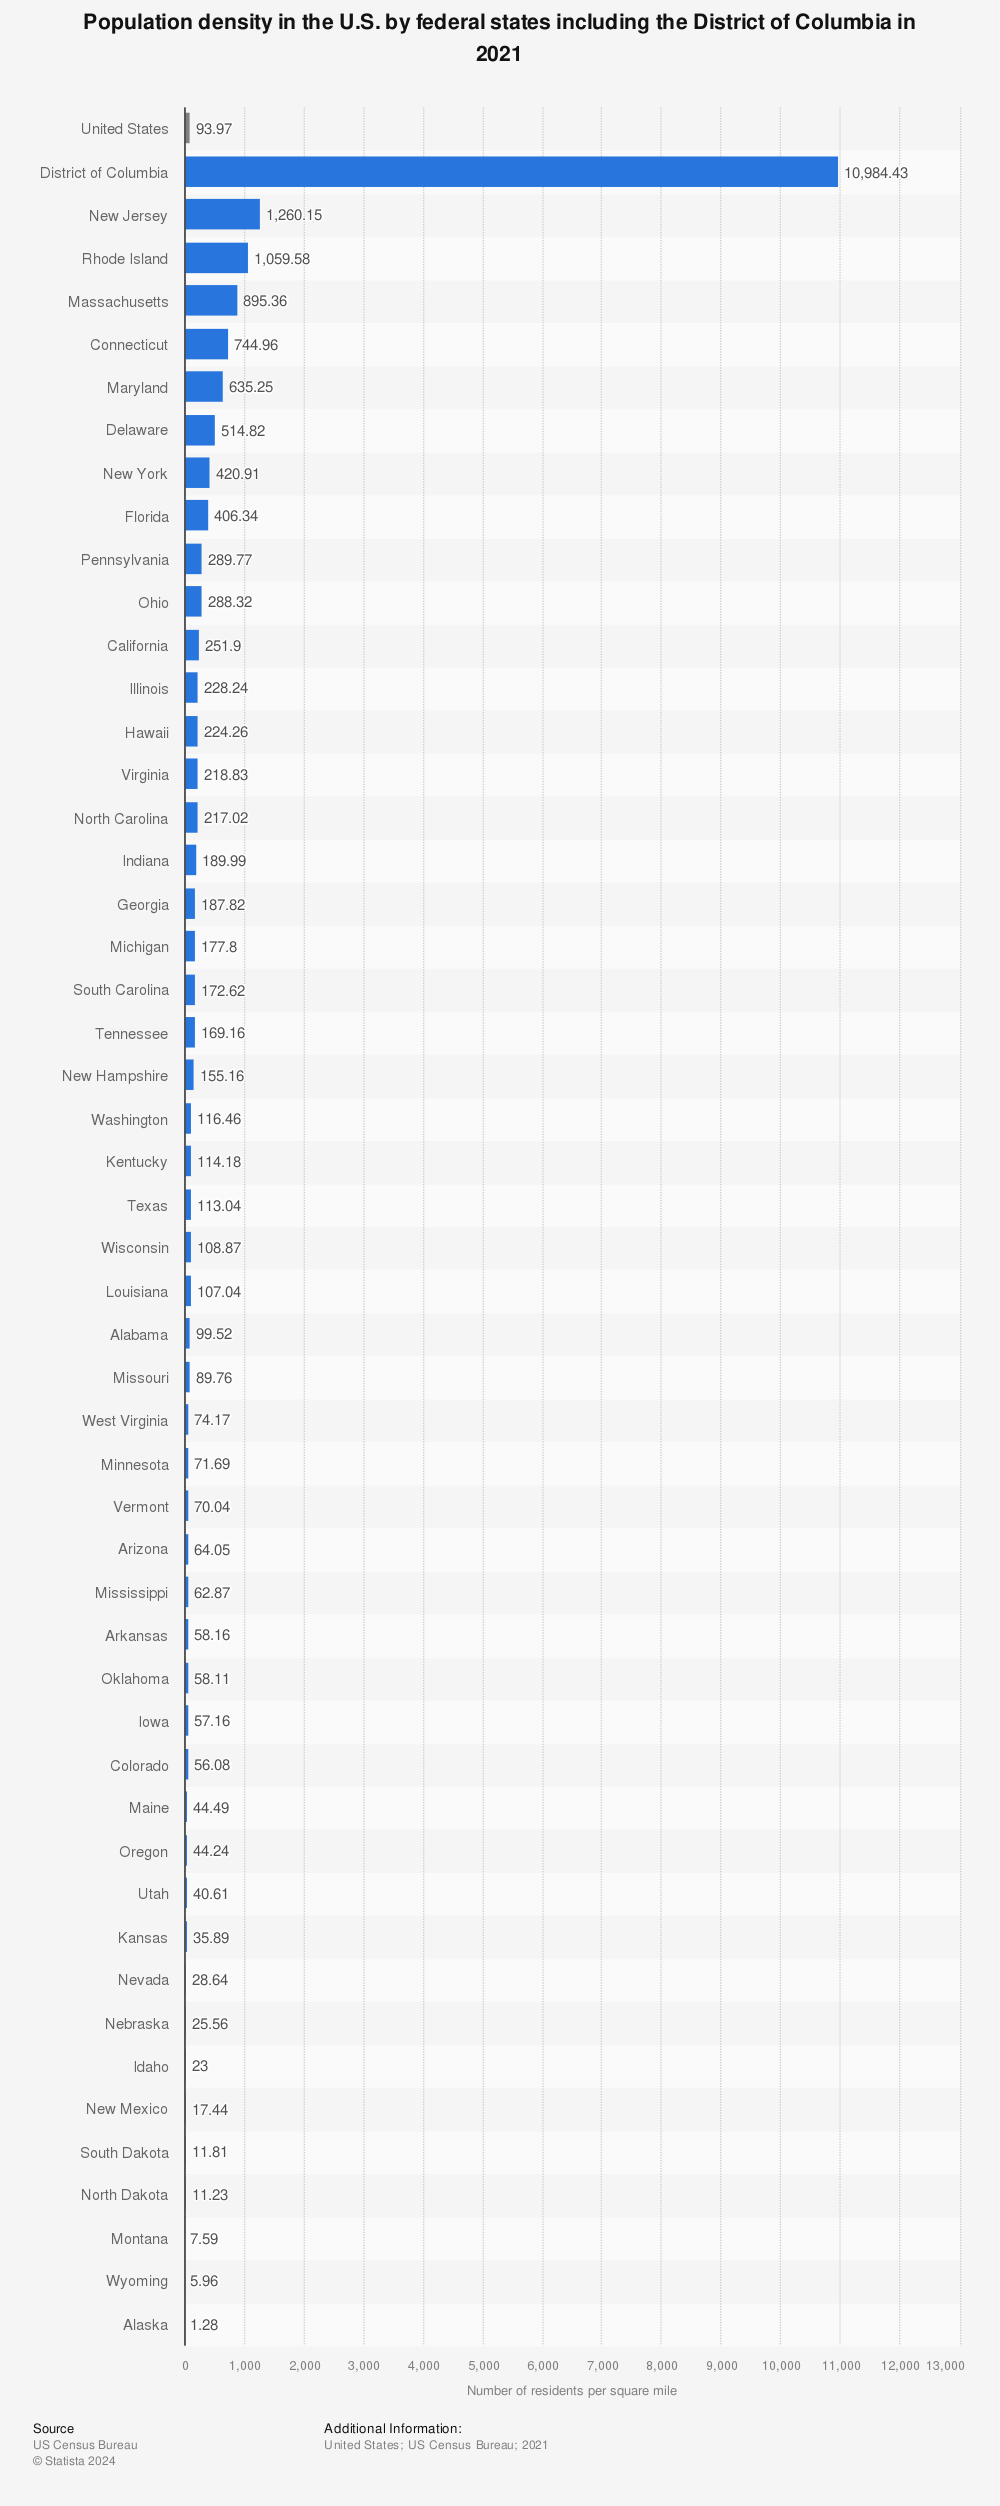
The population density of the United States varies from state to state. The most densely populated state is New Jersey, with 1,208 people per square mile living there. Rhode Island is the second most densely populated state, with slightly over 1,000 inhabitants per square mile. A number of New England states follow at the top of the ranking, making the northeastern region of the United States the most densely populated region of the country.
The least populated U.S. state is the vast territory of Alaska. Only 1.3 inhabitants per square mile reside in the largest state of the U.S.
Compared to other countries around the world, the United States does not rank within the top 50, in terms of population density. Most of the leading countries and territories are city states. However, the U.S. is one of the most populous countries in the world, with a total population of over 327 million inhabitants, as of 2018.
Statista has a graphic which gives the population density by state:
Find more statistics at Statista.
Population Growth
A driving force behind increased population density was, of course, increasing population. The population of the U.S. increased ~78 X from 1790 (3.9 million) to 2010 (309 million).

Urbanization
But urbanization has also been a big factor. From Wikipedia:
In Colonial America, agriculture was the primary livelihood for 90% of the population, and most towns were shipping points for the export of agricultural products. Most farms were geared toward subsistence production for family use. The rapid growth of population and the expansion of the frontier opened up large numbers of new farms, and clearing the land was a major preoccupation of farmers. After 1800, cotton became the chief crop in southern plantations, and the chief American export. After 1840, industrialization and urbanization opened up lucrative domestic markets. The number of farms grew from 1.4 million in 1850, to 4.0 million in 1880, and 6.4 million in 1910; then started to fall, dropping to 5.6 million in 1950 and 2.2 million in 2008.
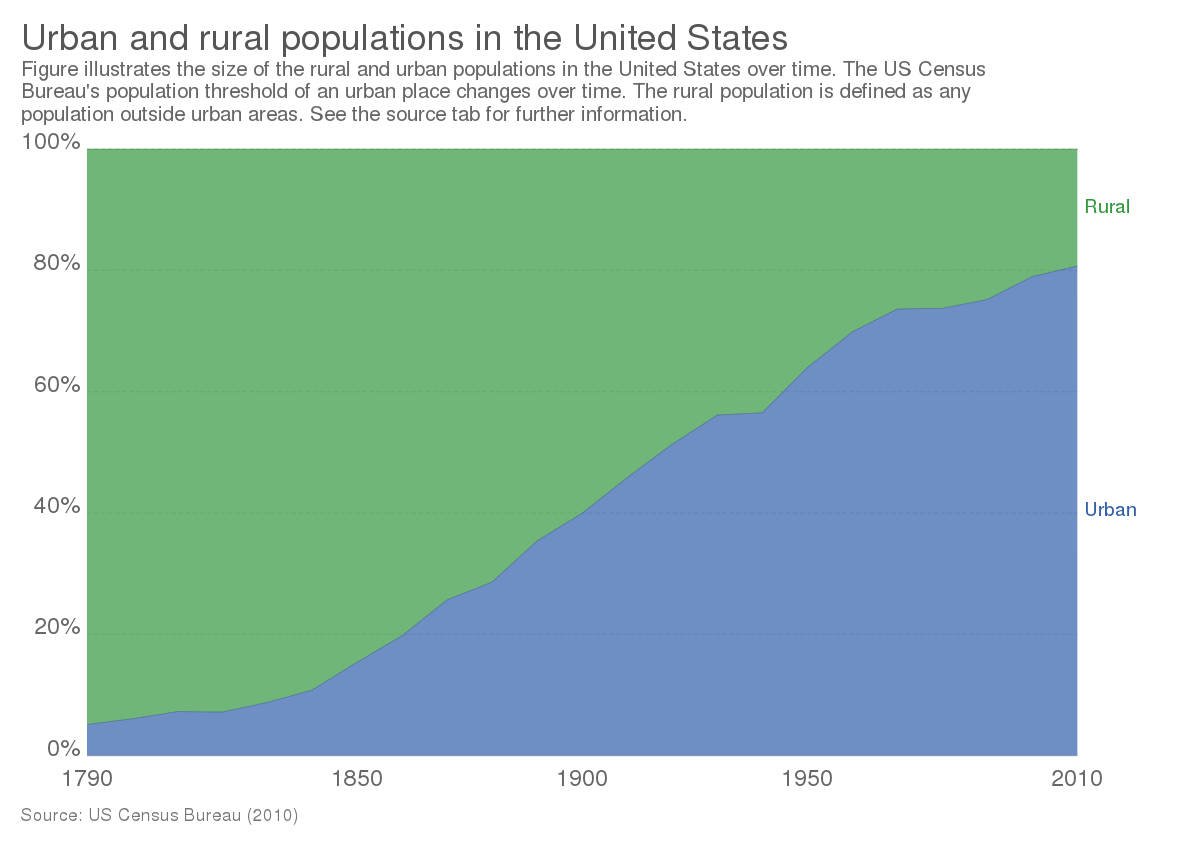
By Our World In Data, CC BY 3.0, from Wikipedia
The urban population increased by ~1200 X from 1790 (~200,000) to 2010 (~249 million), while the rural population has grown only 15.5 X from 1790 (~3.79 million) to 2010 (~59 million). (Calculated from data at Wikipedia). The ratio of population growth urban/rural is ~80 X, essentially the same as ~78 X for total population growth ited prevously.
Urbanization has grown at approximately the same rate as total population.
Of course, these are toal country averages and data will vary widely among vaious states. Such a detailed set of computations is too comprehensive for this short note.
 Times Square New York City, artistic affect with crowds of people Circe Denyer, CC0 Public Domain
.


