by Nadeem Walayat
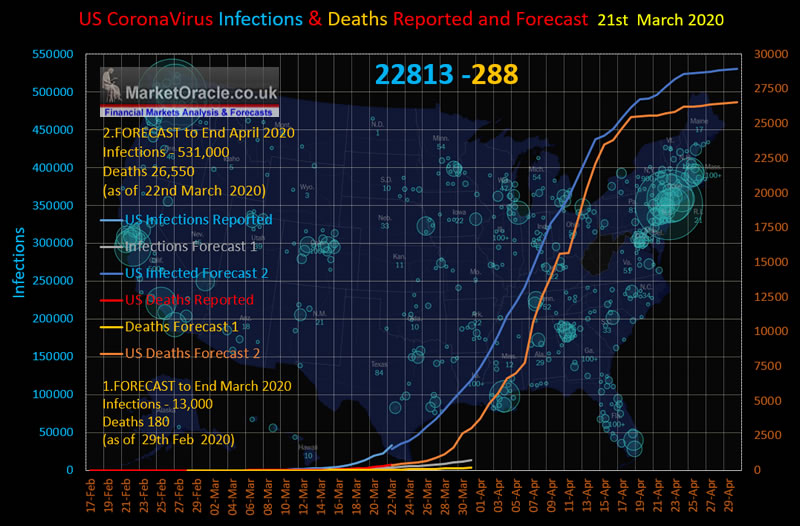
My forecast as of 22nd of March is for the US to trend towards 531,000 tested as infected by the end of April coupled with 26,550 deaths, for a Case Fatality Rate (CFR) of 5%, as it was hoped that valuable time would not be squandered on political bickering during this escalating national emergency, where every day counts.

Please share this article – Go to very top of page, right hand side, for social media buttons.
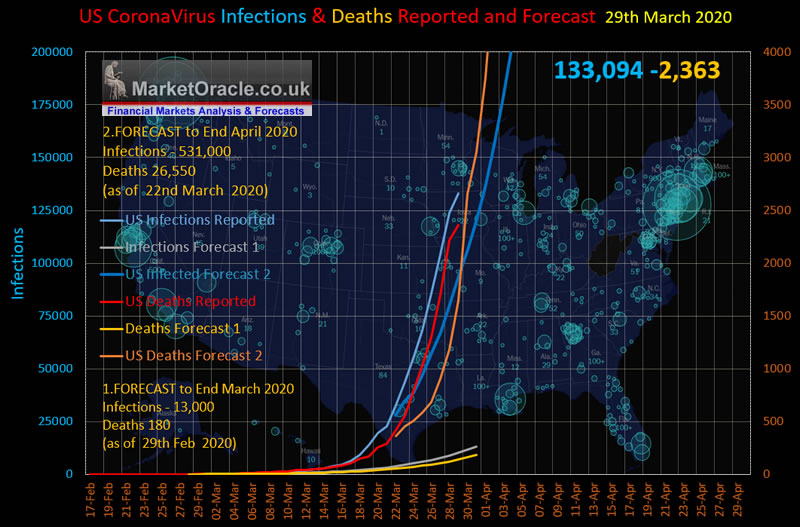
Last week’s data as of 29th March continued to show a ballistic trend with infections rising to 133,000 against a forecast trend trajectory of 94,000, that implied 750,000 testing positive by the end of April. Whilst the number of deaths was also running well ahead of forecast at 2,363 (CFR 1.8%) vs 1,646 forecast that implied to expect 38,000 deaths by the end of April.
The latest data as of 5th April has the US infections continuing on a ballistic trajectory now standing at 336,673, more than 10 times the number of just 2 weeks ago! Well beyond my forecast trend trajectory of 224,724, where if this deviation persists then would imply 800,000 testing positive by the end of April. Whilst the number of deaths is also running ahead of my forecast at 9,696 vs 7,097 that now implies to expect 36,000 deaths by the end of April which is down from 38,000 of last week so some good news is finally start to emerge as the exponential curves for both infections and deaths IS starting to moderate which means the numbers should converge towards my forecasts of 531,000 and 26,549 by the end of April.
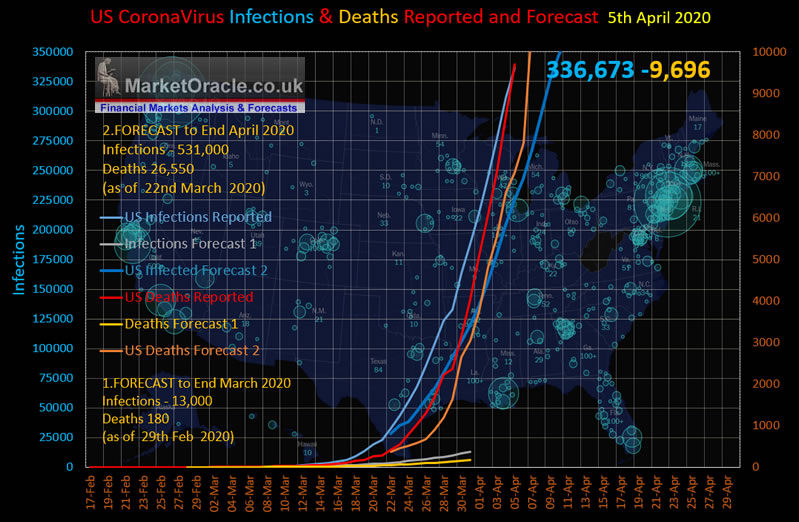
Meanwhile the CFR continues to rise, up from 2% last week to 2.9% this week, tracking a trend towards at least 5% by the end of April.
So overall it might not sound like it but there is finally some good news as the parabolic curves are moderating. Yes there will be a lot more deaths to come to probably triple today’s number by the end of April which is due to the lag of 3-5 weeks between people becoming infected and showing up in hospital and then dying. Hopefully this trend will persist over the coming week as other States take note of New York’s experience and have acted to prevent the same taking place in their states.
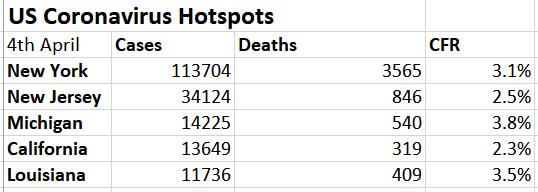
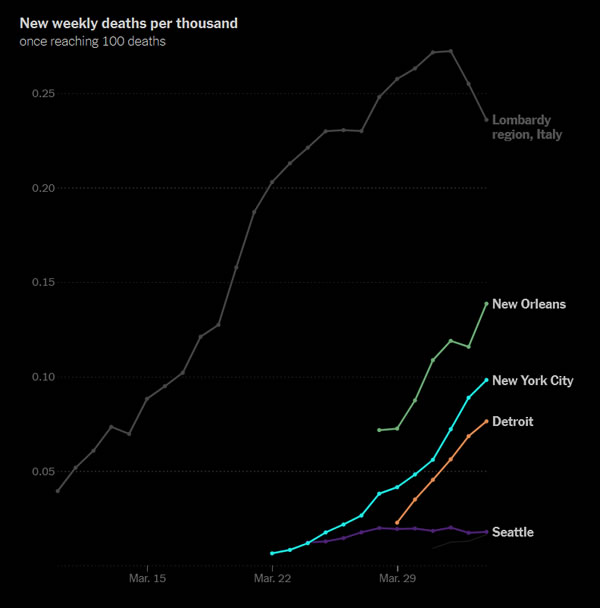
All of the top 5 hotspots continue to resolve to a CFR of more than 3%, regardless of the numbers testing positive. Most notable of which is Louisiana where the likes of New Orleans basically ignored the warnings out of Europe and New York of and went ahead with their street parties that allowed the infected to spew viral particles across huge crowds hence resulting in the current surge in cases and deaths, which also illustrates that unlike the flu hot weather is not going to offer much respite.
Why are the deaths increasing if the there is more testing, for if the logic of the flu-earthers was correct and that the % of deaths was high because people were not being tested in enough numbers, then surely now that the US IS testing on a mass scale then the % dying would be decreasing and not increasing.
The percentage dying are INCREASING because –
1. The time between being infected and dying is about 4-5 weeks. Thus those dying today were infected about 4-5 weeks ago! i.e. when the number of tested as infected was around 1/30th today’s numbers!
How can that be? We’ll it’s because this is NOT the Flu, it is far worse thus the CFR IS and WILL be far higher than that of the FLU, probably at least 30 times as deadly as the Flu.
2. US hospitals starting in New York are becoming overloaded which means there is diminishing capacity to treat new patients with interventions’s such as ventilators which is why the percentage dying will continue to increase to at least 5% by the end of April and higher still during May.
3. Most of those on ventilators will die, maybe as high as 85% as is the experience of Italy, and thus will be added to the death toll even as the number of newly infected falls.
Hence the death rates will keep climbing and thus like Italy the US looks set to be heading towards a CFR of well above 5%, maybe peaking at 10% during May, which will be regardless of how many people are testing positive as the number dying will just keep increasing.
Meanwhile the mainstream media is focused on graphs showing that the US now has more infections and deaths than China .However knowing that the Chinese data is fake, I doubt that the be true. So understand this whatever happens to be the number of US deaths i.e. 50,000, 100,000, or 200,000. The actual number of Chinese deaths will have been FAR HIGHER! It’s just that the totalitarian state that unleashed the plague on the planet is very good at hiding the bodies. For instance I don’t buy the story that the Wuhan plague was just limited to Hubei province.
Meanwhile panic buying appears to have returned to China, which suggests that the Wuhan plague has not been contained.
2nd April – Panic-Buying Erupts Across China, Prompting Food Shortage Concerns
Which is ironic given that the clueless British press were running stories implying the opposite just a few days earlier – 30th March – Panic-buying doesn’t happen in China – scenes from UK shock people here, expat says
Anyway when the coronavirus dust settles there will be a reckoning with China. Which I am sure even dovish US politicians will be most eager to pursue given the War with China Mega-Trend.
The rest of this extensive analysis has first be made available to Patrons who support my work: UK and US Coronavirus Trend, America’s “Pearl Harbour” Moment in War with China Mega-trend
- UK and US Coronavirus Catastrophe Due to Government Negligence
- America’s “Pearl Harbour” Moment – War With China Mega-trend
- US Coronavirus Infections and Deaths Trend Trajectory Current State
- UK Coronavirus Infections and Deaths Trend Trajectory Current State
- Stock Market Trend Implications
- AI Stocks Buying Levels
- WIndfall Taxes
- Risk of Death
Appeared on Market Oracle 07 April 2020.
.


