by UPFINA
The Q3 NY Fed Household Debt & Credit report was released this week, but we will start this discussion with data updated as of Q2. U.S. consumers are in great shape. This cycle has been a huge deleveraging event. Nominal household debt even fell in the first few years of this expansion as it bottomed in Q2 2013.

Please share this article – Go to very top of page, right hand side, for social media buttons.
If this expansion started when debt started increasing in 2013, it would be 6 years old and fewer people would fear a recession. The fact that this expansion is the longest since the 1800s makes people unusually worried about a recession. 2/3rds of the economy implies that the probability of a deep recession is not great.
As you can see from the chart below, financial obligations as a share of disposable income is only 15%. Besides a blip in 2012, this is the lowest reading since at least 1980.
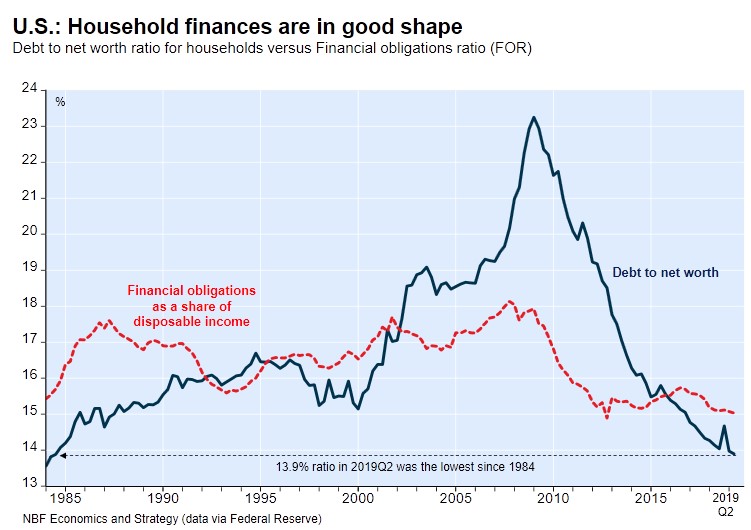
Source: NBF Economics & Strategy
This ratio increased prior to the last three recessions. It has decreased this time. The chart also shows the debt to net worth ratio is 13.9% which is the lowest since 1984. Critics would say that this is suppressed by the rising stock market. Rising asset prices play a part, but the fact that mortgage debt hasn’t reached its 2008 peak and credit card debt is only $10 billion above last cycle’s peak shows you consumers are more cautious this expansion.
The other important data point which makes consumers look good is household debt payments as a percentage of disposable income. As of Q2, it was 9.7% which is the lowest rate since at least 1980. This low rate is a combination of low interest rates and conservative consumers. However, even if interest rates rise, most of current mortgage debt is locked in at low rates. That means about 2/3rds of debt wouldn’t feel the brunt of the rise. Rates would need to stay high for interest payments to push the debt servicing rate significantly higher.
Q3 NY Fed Household Debt & Credit Report
In the NY Fed report, debt increased $92 billion which is a 0.7% increase. The $13.95 trillion in debt is above the 2008 peak of $12.68 trillion. That’s only a 0.96% compound annual growth rate. The fact that housing debt is down from $9.99 trillion to $9.83 trillion in an 11 year period shows how artificial the housing bubble was and how growth has been more stable this cycle. As you can see from the chart below, mortgage debt is only 67.6% of total debt. It peaked at almost 74% last cycle. Credit card debt also isn’t an issue as it’s at $880 billion and it peaked at $870 billion in 2008. It took 10.75 years to grow about 1%. As you can see, it is 6.3% of total debt.
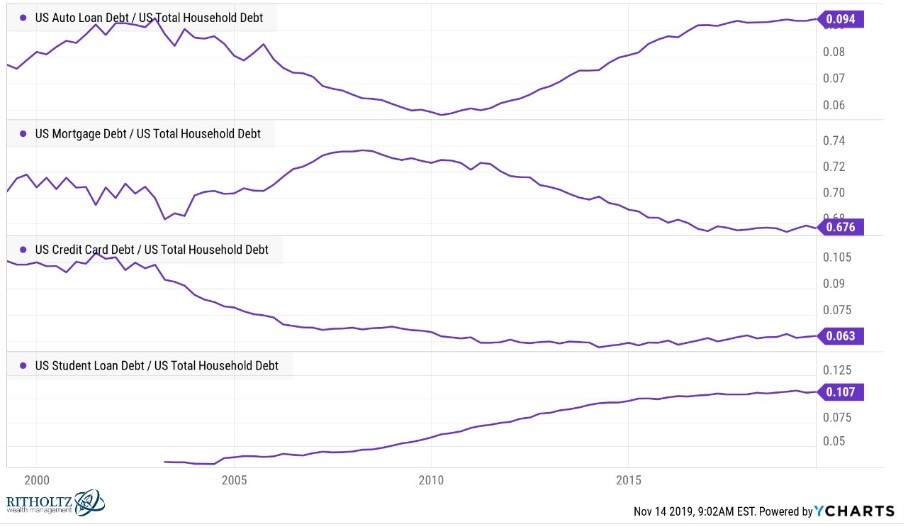
Source: YCharts & Ritholtz Weatth Management
Deep Dive Into Student & Auto Loans
This cycle has been driven by student loans and auto loans. In Q3, auto and student loans increased $18 billion and $20 billion to $1.32 and $1.5 trillion. However, in Q3 student loan balances grew 3.88% yearly which was the lowest growth rate since the NY Fed started tracking this data in 2004. The chart above shows the rapid growth in its debt share occurred in the first half of this expansion. There hasn’t been much change since 2015.
Student loan debt is still a controversial issue because the people who took out the loans are stuck paying them off after many years. The 90+ day delinquency rate on these loans is high. In Q3 it increased 0.1% to 10.9% which is the highest by far out of any other type of debt, but is in the range it has been in for the past 7 years. The scarier issue is in the fine print of this report, it states the delinquency rate is roughly twice as high as listed because about half of student loans are in deferment, grace periods, or forbearance so they are temporarily not in the repayment cycle.
You can’t look at student loan debt in terms of cycles because it’s the one type of debt that didn’t fall during the recession when the greatest amount of deleveraging occurred. However, you can for auto debt. It peaked at $830 billion in Q3 2005. That’s 59% growth in 14 years. Its delinquency rate is more of an issue than the other cyclical debt categories as it’s 90+ day rate increased from 4.6% to 4.7%. Last cycle in 2010, it peaked at 5.3%. If there is a recession soon, it would probably beat that high. It’s interesting that even with this relatively high delinquency rate, motor vehicle sales haven’t been that weak. The pace of sales has been 16.9 million per month this year which is below 17.2 million and 17.1 million in the prior 2 years, which isn’t terrible. It’s still in its plateau phase.
Delinquency Rates
To be clear, the delinquency rate on credit cards stayed at 8.3% and the delinquency rate on mortgages increased 0.1% to 1%. This all adds up to the increase seen in the chart below. The rate increased to 4.78% which isn’t bad, but something to watch for in the next few reports.

Huge Drop In Consumer Confidence
Most of this article paints the consumer in a positive light. However, recently the Bloomberg Consumer Comfort index has collapsed which is a bad sign for the holiday shopping season. The chart below shows the steepest 3 week decline since 2008.

This decline was driven by those with lower working wages. That’s surprising because low wage growth has been the highest. Those making $50,000 or less have seen comfort fall 10 straight weeks. That’s the longest decline since 2010. This segment of the population is generally the first to be hurt by a slowdown in the economy or a recession, so this is an indicator to continue to monitor. The overall reading fell to 58 which is a 9 month low. Consumers’ opinion on the economy fell to the lowest since June 2008, their assessment of their personal finances fell to the lowest since January, and their opinion on the buying climate was the weakest since June.
Conclusion
Consumer finances look fine mostly because mortgage debt has increased slowly this cycle. The big debt creators were autos loans and student loans this expansion. Even student loan debt growth has recently slowed. The delinquency rate on all debt increased a bit in Q3, but that’s no cause for alarm yet. What is cause for alarm is the major drop in the consumer comfort index which was the largest since 2008.
Have comments? Join the conversation on Twitter.
x


