by UPFINA
It seems like almost every new data point on housing shows weakness. That’s because even though millennials are entering their prime age for home buying, starter homes have become unaffordable.

Please share this article – Go to very top of page, right hand side, for social media buttons.
Housing prices for houses less than 75% of the cost of median houses increased 8.9% from September 2016 to September 2017 which was above the 6.4% increase for all homes. Millennials are delaying home buying which is also delaying peak demand. The most common age is 27 in 2018. Millennials waiting until their early 30s to buy a house pushes off this demand. Even though the labor market is extremely robust as weekly wage growth is at a cycle high and the underemployment rate is at a cycle low, shelter inflation outperforming overall CPI has taken a toll on affordability.
The weekly MBA mortgage applications report showed the composite index fell 4% week over week in the week of November 2nd. That’s after it fell 2.5% in the previous week. The purchase index fell 5.0% after falling 2%. On an unadjusted basis the purchase index is 0.2% below where it was last year and is at the lowest level since November 2016. Rising interest rates and expensive housing are turning this quickly into a buyer’s market. The refinancing index fell 3% after falling 4% in the previous week. Refinancing fell to 39.1% of the mortgage market which makes sense because rates are rising. 30 year rates for mortgages less than $453,100 were up 4 basis points to 5.15% which is the highest rate since April 2010.
Housing Inventory Increases
As you can see from the chart below, the inventory of new unsold homes hit 7.1 months which is the first time it hit 7 months since 2011.
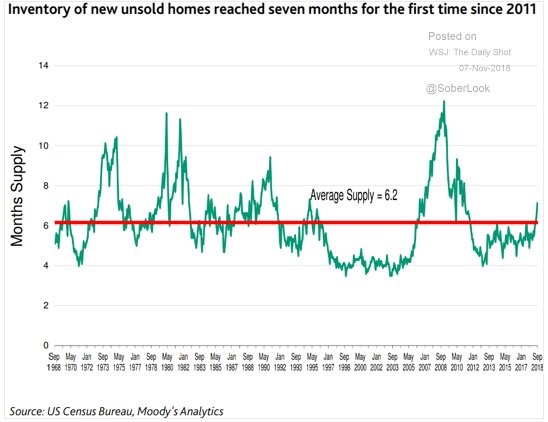
Source: Moody’s Analytics
Back in 2011, the housing market was recovering from the housing crisis, meaning inventory was falling. Inventory is a problem now because affordability is low and getting worse due to rising rates. In Seattle, which was one of the hottest real estate markets this cycle partially because it is where Amazon has its headquarters, sales fell 17.5% and the months of inventory increased from 1.2 to 2.4. That’s still far below the national average, but it signals the housing market is softening. Median home prices fell $25,000 to $750,000 in October in the past month. That’s down $80,000 from the record in the spring.
The housing market is a leading economic indicator. Therefore, it’s no surprise housing inventory leads GDP growth. As you can see from the chart below, since 1968, when new housing inventory has gotten to 7 months, GDP growth has gone negative.
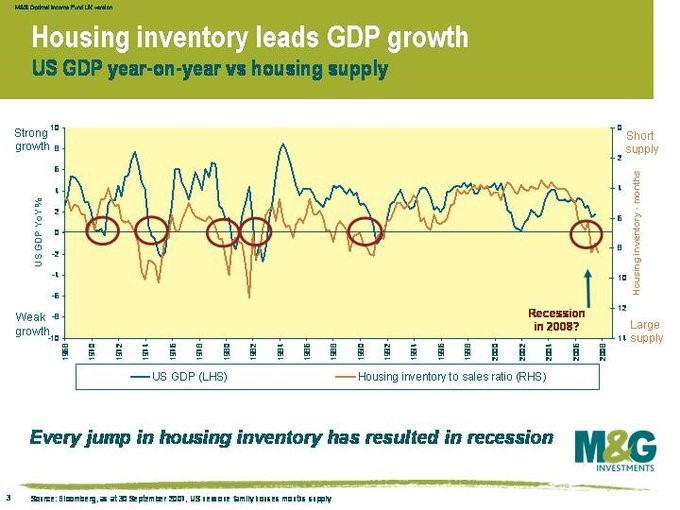
Source: M&G Investments
The chart was made in 2007 and was used to predict the recession in 2008. This seems to indicate there will be a recession in 2019 or 2020. The higher inventory gets, the better chance there will be a recession.
As you can see from the chart below, housing supply has flipped.
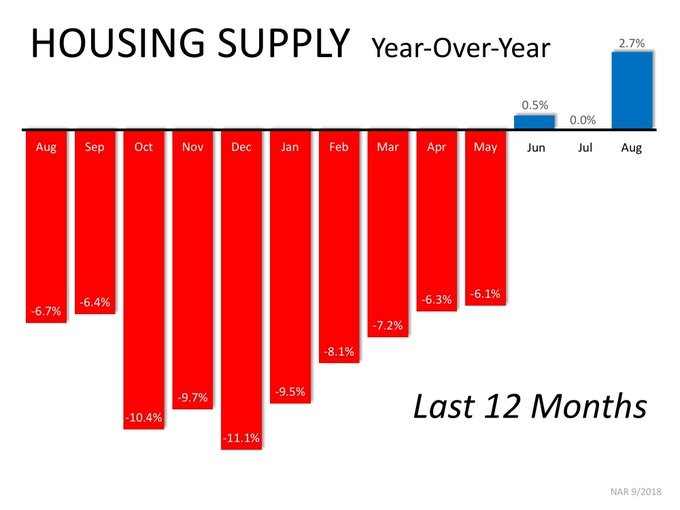
Source: Twitter @bryanclarksells
It was falling from August to May, but in June and August it increased. The Fed appears to be ignoring the warnings signs the housing market is giving off as it is about to raise rates in December for the 4th time in 2018. It will be interesting to see if the Fed catches on to the weakness in housing in its next meetings or if it will whistle past the graveyard like it did in 2007.
Poor September Consumer Credit Report
The consumer drove Q3 GDP growth. If GDP growth is to meet the average estimate of 3.6% growth in Q4, the consumer will need to keep spending this holiday shopping season. The consumer will have the benefit of rising wages and falling gas prices. Despite the strong labor market, low leverage ratio, and decently high savings ratecompared to last cycle, the consumer credit report showed weak growth in September. That’s good for the consumers’ balance sheets, but bad for GDP growth. At this point in the cycle we generally see consumers borrowing to increase spending as confidence is high. Weak credit growth could signal the cycle is near its end.
As you can see from the Bloomberg chart below, the month over month increase in credit was $10.9 billion in September. That was below the lowest estimate for a $12 billion increase.
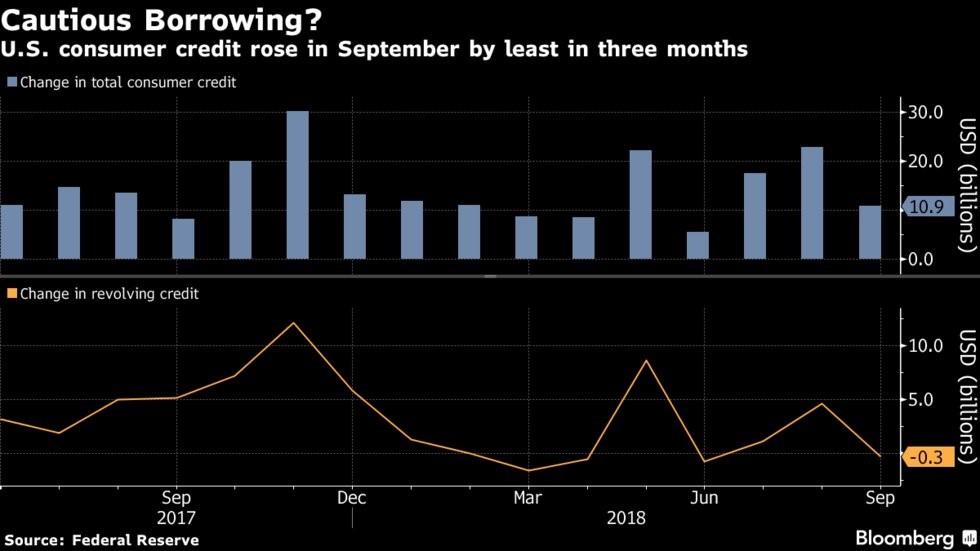
Source: Bloomberg
The consensus was for $16.5 billion. The August reading was revised from $20.1 billion to $22.9 billion. Non-revolving credit was up $11.2 billion after increasing $18.3 billion in August. Revolving credit fell $0.3 billion. Vehicle financing and student loans boosted non-revolving credit and credit card debt catalyzed the decline in revolving debt. To be clear, consumer credit growth was still up 4.8% year over year. The consumer isn’t pulling back sharply yet. This was just a weak report sequentially. Student loan debt was up 5.6% year over year in Q3 which is very close to the lowest growth rate since the data started being calculated in Q1 2007.
Hurricane Hurts JOLTS
The strong labor market continues to support the consumer. However, the September Job Openings and Labor Turnover report showed slight sequential weakness because of the hurricane. The number of job openings was revised from 7.136 million in August to 7.293 million. The September reading weakened to 7.009 million which missed estimates for 7.11 million and the lowest estimate which was 7.1 million. Year over year job opening growth fell from 18.1%to 12.5%.
Hires fell from 5.906 million to 5.744 million. The difference between openings and hires fell from 1.386 million to 1.265 million. It would have been better if that difference declined because more people were hired instead of the openings rate falling. The quits rate stayed at the 17 year high of 2.4%. The chart below shows the quits to hires and the openings to unemployed ratios are still elevated. There are now 5.964 million unemployed people looking for work.
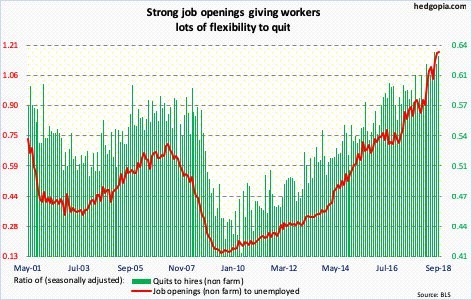
Source: Hedgopia
Conclusion
The housing market is giving off warning signs about a recession in 1-2 years. The consumer credit and JOLTS reports were weak sequentially, but strong on a year over year basis. We’ll need to see much more weakness in consumer credit and the labor market for a recession to be imminent. We’ll be watching the new home inventory rate to see if that report was a blip or representative of a trend.


