Written by John Lounsbury
On 26 March in our column ‘What We Read Today‘ we reported on a post which posited that “religiosity kills”. At that time we wrote:
Econintersect calls (possible) BS on this one. We will do some analysis and publish a note if we can remove the (possible) above.
This is the result of that investigation.

Please share this article – Go to very top of page, right hand side, for social media buttons.
The post which prompted this investigation was written by Robert Waldmann at Alternative Economics: Blue State Red State, Blue State Dead State. Some readers may be familiar with Waldmann; he is a regular contributor the Angry Bear blog. Here is what he wrote at Alternative Economics:
Back when he was a conservative (and didn’t just play one on TV) David Brooks specialized in the ecological inference fallacy. He tried to argue that the Democratic party was the elite party, because Democratic “blue” states are wealthier than red states. He wrote as if all people in blue states were upper middle class as he and all the people he knows are.
This is passé. Current conservatives just replace data with prejudice. For example, someone tweeted “Still doesn’t answer why these red states don’t have higher mass shootings and murders.” (picking on a random tweet is called the “nut picking fallacy”). This is hard to answer, since those red states do have higher murder rates.. Some people are sure this must not be true as soft on crime liberalism leads to lots of crime. However, there are tens of thousands of dead people who won’t argue back (being dead).
So I decided to look at maps of murder and church attendence. By Brooksian logic we can conclude that religiosity kills.
Here are the maps Waldmann presented:

Church or synagogue attendance by state in 2009. By Falcorian – Self made, using this blank map as a template, with map key from this map, CC BY-SA 3.0.
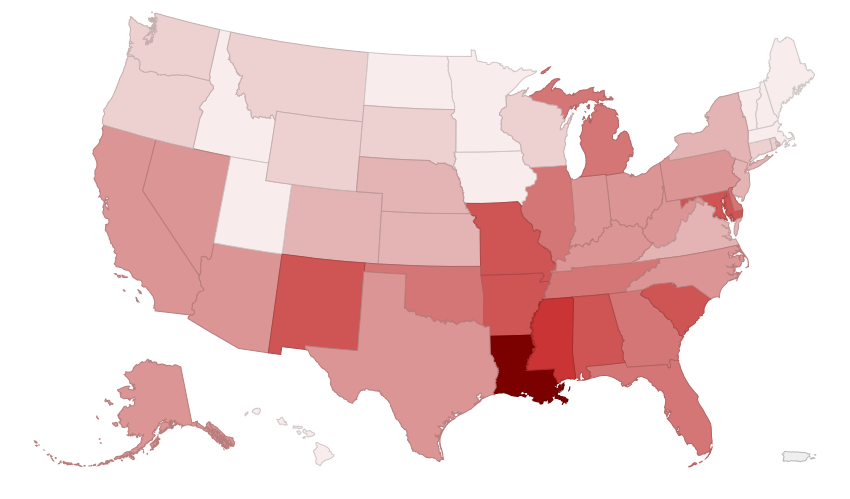

United States Map of Homicide Deaths per 100,000 People by State By Datawheel – Interactive Visualization: Data USAData Source: University of Wisconsin – County Health Rankings, CC0.
First glance may allow you to accept Waldmann’s conclusion that religiosity kills. Look, for example at the states of the lower Mississippi Valley and the southeast and compare to the states of the upper Mississippi Valley and New England. You might stop there and say: Point made.
But you would be wrong.
The data used to construct the two maps are also shown in the Wikipedia articles displaying the maps.
Here is the religion data:


We have presented the data in new tables. The homicide data shows much volatility from year to year so we have averaged the data from 2005 to 2016. The two tables (and accompanying graphics) below show the states with ranking data (1 is highest religiosity and highest homicide) plus the states with the data as reported.
State Ranking Analysis
![]()
![]()
This data treatment ranks the states 1 through 50 for religiosity and again for homicide rates. Religiosity data is for the year 2014 and the homicide rate is the average for the four years 2005, 2010, 2014, and 2016.
It is evident by inspection that the data is almost randomly scattered in the graph. That is confirmed by the R-squared value of 0.1713 which indicates a correlation of 41%. By our convention a correlation between 40% and 60% is considered fair, while 20% to 40% is weak. The ranking data indicates the correlation between religiosity and homicides is borderline between weak and fair.
This analysis would indicate there is no validity in Walmann’s representation that “religiosity kills”. Of course this analysis would also conclude that religiosity has little correlation with the prevention of homicides as well.
State Data Analysis

 The correlation improves when the actual data is used rather than the rankings. The R-squared value 0.2853 indicates a correlation of 53% which is in the upper half of the fair correlation range. Still this is significantly below the bottom of the good correlation range (60-80%) so it is not reasonable to start to talk about direction of primary causation because there are likely other significant factors that determine homicide rates.
What we can state is that one of four conditions apply:
- There is a possibility that higher religiosity is a factor in causing higher homicide rates;
- There is a possibility that higher homicide rates is a factor in causing higher religiosity;
- There is a possibility that both religiosity and homicides share common causative factors; or
- There is a possibility that the correlation is largely circumstantial.
While there are possibilities of some causative factors in the common increasing of homicides and religiosity, it is reasonable to conclude that religiosity cannot be ascribed any significant factor in reducing homicides. The trend line has the wrong slope for that. In fact the largest data outlier here is for Louisiana which has the second highest religiosity and the highest homicide rate while Vermont has the lowest religiosity and the second lowest homicide rate.
To conclude, the data indicates that Mr. Waldmann was off base when he said that “religiosity kills”. On the other hand, there is not much indication that religiosity has any special benefit for reducing homicides for a populations as a whole either.


