The current market data indicates that Bitcoin’s (BTC) rally to $18,300 is the only possible Santa Claus rally the crypto will see before the end of this year.

As the coldest days of the crypto winter creep in, investors’ speculative interest in the crypto market has dropped to pre-2021 levels, impairing the possibility of a considerable directional price move. Nevertheless, there is a likelihood of a bear market rally similar to the July/August 2022 uptrend.
The Crypto Market Is In A State Of Limbo
The FTX exchange implosion affected more than 5 million users around the world and severely impacted many crypto firms that were exposed to it. The sector is now in a recovery mode and Cumberland, a U.S.-based cryptocurrency market broker, recently reiterated the narrative in a tweet. The company noted that:
“Dozens of crypto companies are either severely curtailed or out of business, and the industry’s future is as cloudy as ever.”
Data indicates that building a huge and sustainable bullish move will be quite challenging since the market is pushed back to a low liquidity and volatility regime.
Glassnode, a crypto analytics company, reported “depressing” futures volumes for Ethereum and Bitcoin, tracing back to the pre-2021 levels when the price of Bitcoin surpassed $20,000 for the first time.
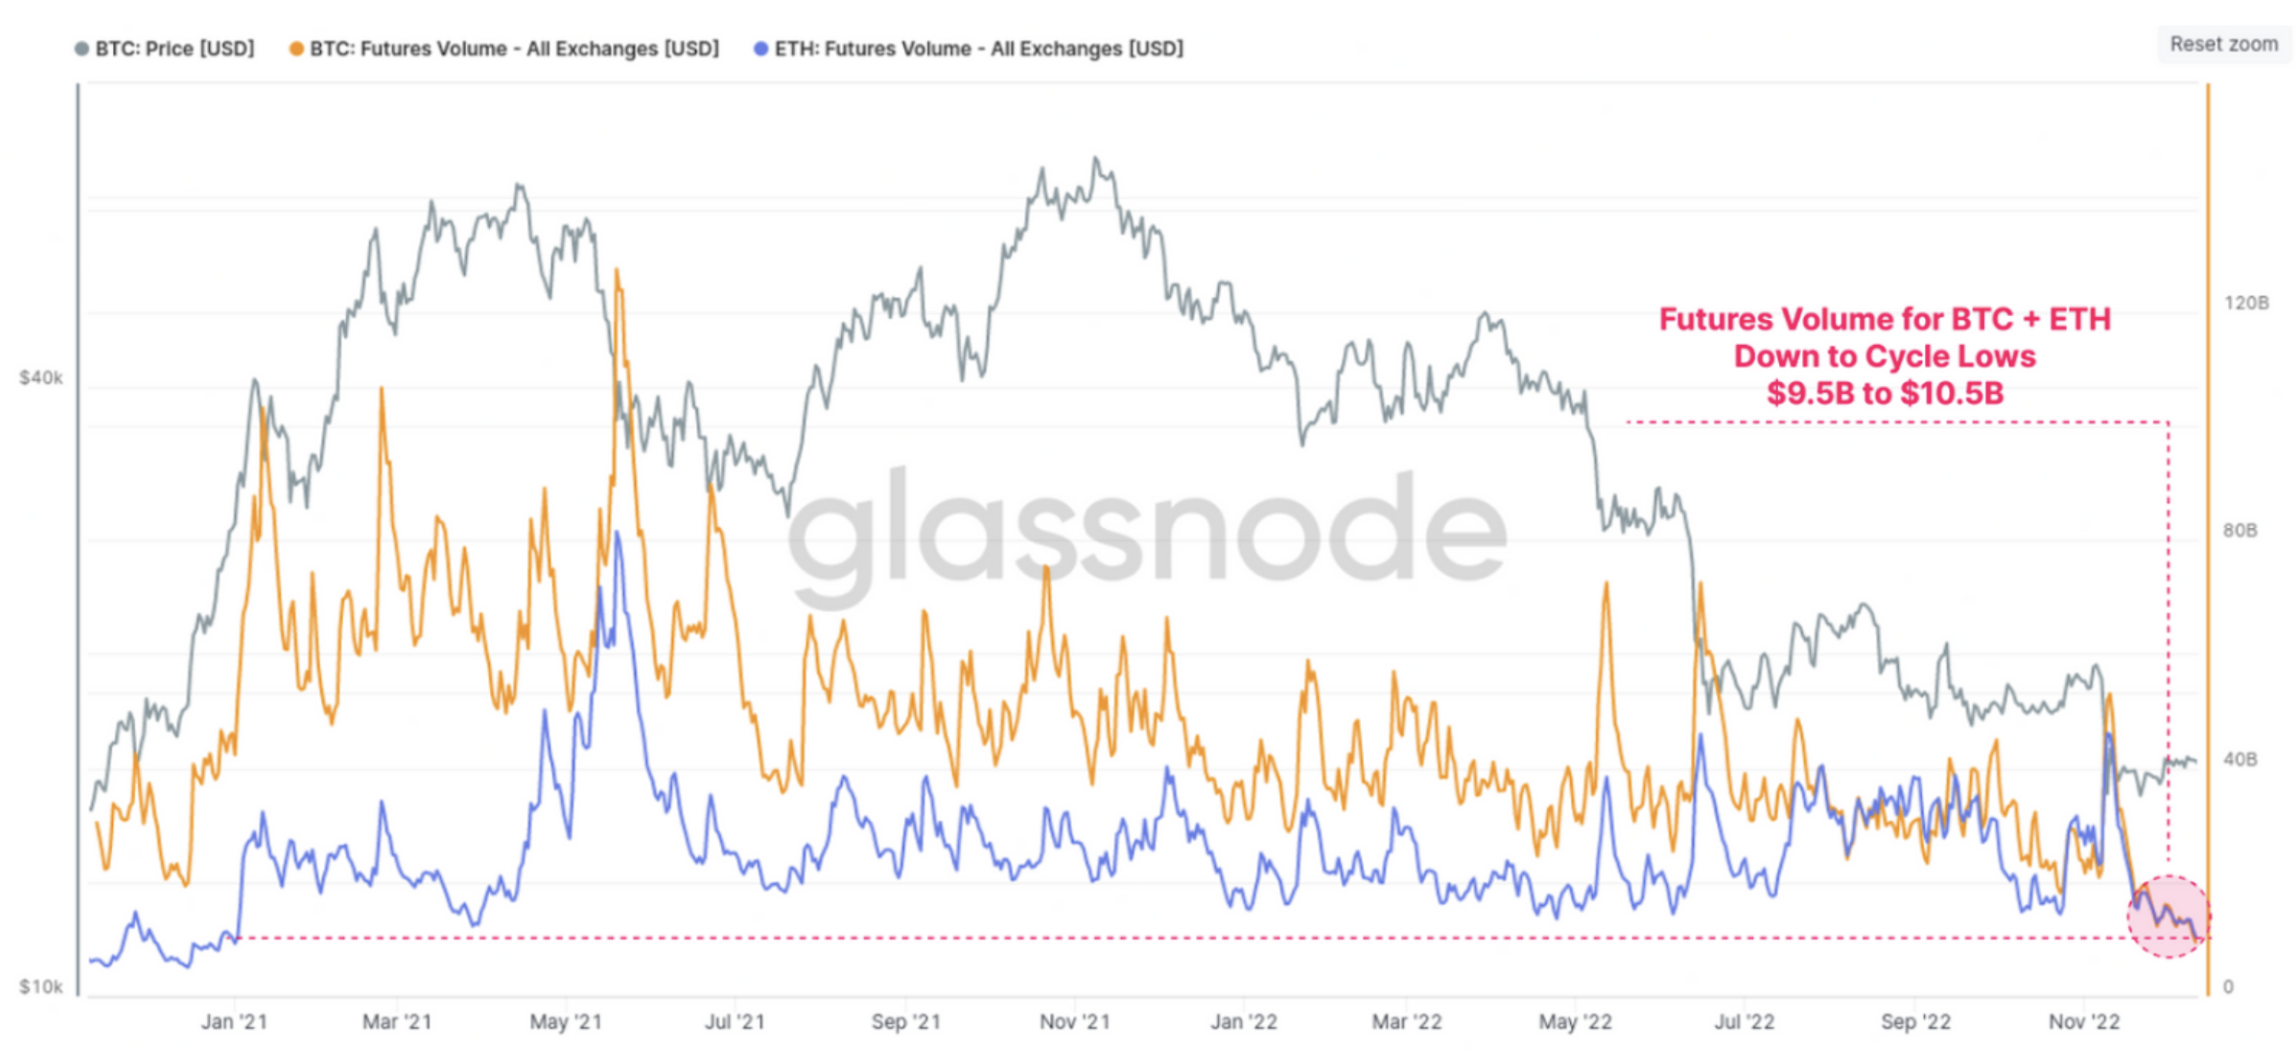
The open interest volume of Bitcoin and Ethereum futures has plunged considerably toward mid-2022 levels, which was after the rapid collapse of Luna-UST. The Bitcoin (BTC) and Ethereum (ETH) leverage ratio indicator, which measures the ratio between open interest volumes, is now down to 2.5% and 3.1% respectively.
Bitcoin’s spot trading volumes on crypto exchanges have plunged massively toward 2020 lows. Data acquired from Blockchain.com indicates that the 7-day moving average of exchange trading volume has plunged to $67 million, compared to around $1.4 billion near the peak of the 2021 bull market.

Because of low liquidity and a dark cloud of uncertainty over the market, there is a strong chance that the bear market is far from over. The realized volatility of Bitcoin has also plunged toward 2-year lows of 22% (1 week), and 28% (2 weeks).
Going forward, volatility might remain dull, with more sideways or slow downside price action expected. Nonetheless, there is still a possibility for a near-term bear market rally.
Is A Bitcoin Price Pump And Dump Happening?
November’s FTX-induced shakeout resembled the LUNA-UST implosion witnessed in June and these events normally cause a lot of panic selling and make an asset attractive to bargain hunters seeking to buy into a capitulation.
Subsequently, a near-term bull rally takes effect that may last a few days or weeks, which is what happened from July up to August when the price of Bitcoin increased toward $25,000. According to the shakeout levels seen in November and signs of institutional buying, Bitcoin might currently be experiencing a similar bear market rally.
The realized profit and loss metric of long-term holders plunged toward all-time lows, showing possible oversold conditions. The long-term holder realized losses had reached some comparable levels only in the 2015 and 2018 bottom.

Moreover, the futures market is now in backwardation, which means there are more open short positions than long. In the whole of Bitcoin’s history, similar conditions have lasted for short periods only and ended up in a short-term pump to help squeeze the short orders.

The accumulation trend among the whales and institutions, which was negative for most of the year, turned positive in mid-November. A growth in holdings of these types of investor cohorts offered a tailwind for the bear market rally in the third quarter of 2022.
Buy Bitcoin NowBased on CoinShares reports Bitcoin investment vehicles recorded inflows of up to $108 million after the FTX collapse, with $17 million added in the past week. Interestingly, the present inflows are considerably lower than weeks 25 and 35 this year, which resulted in an uptrend toward $25,000.

On-chain data published by Glassnode indicates positive accumulation among the Bitcoin whales, identified as addresses that hold more or equal to 100 BTC (worth about $1.7 million at current prices).
While the holdings of Bitcoin whales have increased from their annual lows in a similar manner seen in July to August, BTC price is yet to reflect the positive addition.

Technically, the market resistance and support levels from the past trading range between $18,700 and $22,000 might form the local top levels of the current rally. Equally, in case Bitcoin manages to build support above $22,000, the bear market rally might become more meaningful with a sustained uptrend.

Nevertheless, the chances of a bullish rally past $22,000 are weak due to low liquidity and the cloud of uncertainty that will motivate selling as the prices surge. Yet, discounting a near-term bear market rally can punish the late sellers.


