Written by Gary
Opening Market Commentary For 10-01-2014
Premarkets were down -0.3% and opened the same way. The DOW and NASDAQ slipped below its 50 DMA and the SP500 dropped below the 100 DMA and is testing it. Closing below this would signal more weak sessions to come.
By 10 am the volume has fallen off to very low, market is quiet and more weakness is foreseen.

Having said that, it is 60% likely the markets will close higher than where they are now. The morning reaction to the bad print of the US ISM Manufacturing coming in at 56.6, down from 59.0 will not last.
The medium term indicators are leaning towards the hold side at the opening and the short-term market direction meter is neutral. We remain mostly, at best, neutral and conservatively holding. The important DMA’s, volume and a host of other studies have not turned significantly and that is not enough for me to start shorting, but now I am getting very concerned. The SP500 MACD has turned down, but remains below zero at -2.74. I would advise caution in taking any position during this uncertain period although some technical indicators have starting to turn bearish.
Investing.com members’ sentiments are 72 % Bearish and it seems to be a good sign for being bullish. The ‘Sheeples’ always seem to get it wrong.
Investors Intelligence sets the breath at 53.3 % bullish with the status at Bear Confirmed. (Chart Here )
StockChart.com NYSE Bullish Percent Index ($BPNYA) is at 56.50. (Chart Here) Below support zone and apparently going further down. Next stop ~57 and then ~44, below that is where we see the markets crash.
StockChart.com S&P 500 Bullish Percent Index ($BPSPX) is at 67.40. (Chart Here) In support zone and testing.
StockChart.com 10 Year Treasury Note Yield Index ($TNX) is at 24.23. (Chart Here) Treasury Yield Curve Approaches Flattest Since 2009.
StockChart.com Overbought / Oversold Index ($NYMO) is at -50.64. (Chart Here) But anything below -30 / -40 is a concern of going deeper. Oversold conditions on the NYSE McClellan Oscillator usually bounce back at anything over -50 and reverse after reaching +40 oversold.
StockChart.com Consumer Discretionary ETF (XLY) is at 66.14. (Chart Here)
Chris Ciovacco says, “As long as the consumer discretionary ETF (NYSEARCA:XLY) holds above [66.88], all things being equal, it is a good sign for stocks and the U.S. economy.” This chart clearly shows that dropping below 65.50 should be of a great concern to bullish investors.
This $NYA200R chart below is the percentage of stocks above the 200 DMA and is always a good statistic to follow. It can depict a trend of declining equities which is always troubling, especially when it drops below 60% – 55%. Dropping below 40%-35% signals serious continuing weakness and falling averages.
Today it represents the lowest levels seen since the beginning of the October, 2011 rally. Eric Parnell says, ‘ If nothing else, given that relatively fewer stocks are trading above their 200-day moving average at a time when the market is just off of its all-time highs suggests that an increasingly narrowing group of stocks is driving the rally at this stage, which does not bode well for the future sustainability of the uptrend.” It also strongly suggests there has been a ‘stealth bear market’ underway in recent months.
StockChart.com NYSE % of stocks above 200 DMA Index ($NYA200R) is at 47.07 %. (Chart Here) Unless this downward trend reverses itself soon, we are going to see further downside
Guideposts For An Indecisive Stock Market
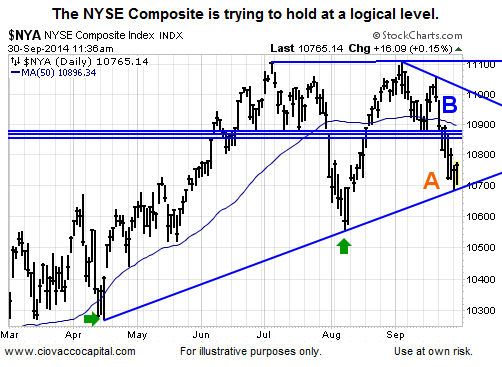
. . . the broader equity market is showing some “pay attention” signals, along with deteriorating market breadth. On the bullish side of the ledger, the longer-term charts still look good and we know an open mind is required when the S&P 500 (NYSEARCA:SPY) is hovering near a flat 50-day moving average (as it is now).
Therefore, drawing lines in the sand can help us balance the need to be patient with the need to protect capital in the event of ongoing weakness. In the short-term, if Monday’s lows are taken out, it increases the odds of additional weakness in stocks (see point A above). The odds of good things happening short-term will increase if the NYSE Composite can close above its 50-day (near point B).
Is The Stock Market Finally Ready To Fall?
Investors are currently unhappy, unenthusiastic, skittish and ready to jump ship every time it nudges against a small financial iceberg. They remain long for now unable to afford to sell and live off cash savings that have negative real rates thanks to the Feds.
They feel in their guts, correctly, that a real ‘correction’ is coming and can’t do anything about it until it is too late. Greed rules the day and investors should be very cautious.
Yes Virginia, The Market Can Go Down
The recent market decline is accelerating through midday trading Thursday. This is something I have been cautioning investors against throughout September.
There are myriad warning signs that are foreshadowing further declines that should be watch items for equity investors as I believe they will drive market direction over the coming months.
What I am watching in the market right now and how I am positioning my own portfolio during this recent uptick in volatility is detailed below.
I hate to say “I told you so” but it looks like my frequent calls for caution in September are turning out to be warranted. The 2,000 level on the S&P 500 has proven to be a significantly stubborn resistance level, something I also predicted.
I am not taking a victory lap as it is hard to make money in a falling market, I am just re-emphasizing investors should not be ignoring myriad warning signs in the market right now.
All in all, the fundamentals and sentiment of the market are currently negative. That is not to say that fund managers who are significantly behind their benchmarks will not come in and buy any dip in an effort to pull even by year end.
However, mainstream investors should keep some powder dry as it appears there is a high likelihood that lower entry points could be ahead.
Bottom line here is that I have not seen any serious bears jumping out of the woods just yet, although I am VERY concerned that ANY minor correction could turn nasty in a heart beat. One significant signal would be daily losses in any of the major averages that go over the ‘magic’ 3 % and then you need to pay close attention to risk-off tactics. There hasn’t been a 10% correction in several years and some investors are becoming increasingly concerned an imminent correction is on the way.
Sometime in the future, there will be another three percent drop, only it will go to four, recover somewhat and the BTFDers will cry halleluiah and buy again. Only this time it doesn’t recover fully like in the past and drops again, increasing the net drop to seven percent and so on.
It is still possible that Mr. Market is not through playing with the averages and even newer historical highs are a distinct possibility. Historically, accordingly to Eric Parnell, “major bull markets have almost never reached their final peak in a sideways grinding pattern. Instead, they have almost always peaked with flourish including one final crescendo toward a new all-time high before finally rolling over and succumbing to the forces of the new bear market”.
These managers are are closely monitoring any signals that Ms. Yellen is going to backtrack on exiting QE and these guys will exit the markets long before the ‘Sheeples’ if she doesn’t. Watch the the fund managers!
The longer 6 month outlook is now 35–65 sell (probably should be 40-60 sell) and will remain bearish until we can see what the effects are in the Fed’s game plan, Russia’s annexing game playing and of course the World’s newest player Iraq, ISIS and Israel. I would also take chart and other technical indicators with a lessor degree of reliability for the time being and watch what the Janet Yellen’s Fed does over the next couple of months.
The DOW at 10:15 is at 16905 down 136 or -0.80%. (the Dow is only up 2.2% in 2014)
The SP500 is at 1960 down 13 or -0.64%.
SPY is at 195.74 down 1.30 or -0.66%.
The $RUT is at 1094 down 8 or -0.70%. (the Russell is now down -5.5% on the month and -4.5% on the year)
NASDAQ is at 4452 down 41 or -0.91%.
NASDAQ 100 is at 4013 down 37 or -0.91%.
How the Popular ‘VIX’ Gauge Works
$VIX ‘Fear Index’ is at 16.79 up 0.47 or 2.88%. Bearish Movement
(Follow Real Time Market Averages at end of this article)
The longer trend is up, the past months trend is net negative, the past 5 sessions have been negative and the current bias is negative.
WTI oil is trading between 92.25 (resistance) and 91.22 (support) today. The session bias remains negative from yesterday’s plunge and is currently trading down at 91.91. (Chart Here)
Brent Crude is trading between 95.46 (resistance) and 94.54 (support) today. The session bias remains negative from yesterday’s plunge and is currently trading down at 95.22. (Chart Here)
Why Gold Will Rise When The Dollar Falls
– and –
The general consensus is that gold prices will actually fall in the next twelve months (Sept to Aug. 2015). Goldman Sachs estimates that gold will fall to $1,050 an ounce, a drop of nearly 19%.
Gold rose from 1205.28 earlier to 1218.60 and is currently trading up at 1217.20. The current intra-session trend is positive. (Chart Here)
Currency Corruption Weighs on Copper
Dr. Copper is at 3.015 falling from 3.048 earlier. (Chart Here)
The US dollar is trading between 86.29 and 85.88 and is currently trading up at 86.01, the bias is currently negative and volatile. (Chart Here) Resistance made in Aug., 2013 has been broken.
The markets are still susceptible to climbing on ‘Bernankellen’ vapor, use caution!
“Investors should remember that excitement and expenses are their enemies. And if they insist on trying to time their participation inequities, they should try to be fearful when others are greedy and greedy only when others are fearful.” – Warren Buffett
If you would like to get advanced buy/sell tweets, sign-up in the column to the right of this post by clicking on the ‘Follow‘ button. Write me with suggestions and I promise not to bite.
Real Time Market Numbers
To contact me with questions, comments or constructive criticism is always encouraged and appreciated:
Written by Gary


