Written by Gary
Midday Market Commentary For 10-01-2014
The morning low volume action shows the DOW is still off triple digits ans along with the SP500, they are both battling to remain above the 100 DMA. Closing below would signal serious negative ramifications to the markets.
By noon investors are seriously wondering if were are going to see the 10% dip everyone is talking about. Now is the time to be cautious as there other indicators that are alarmingly negative.

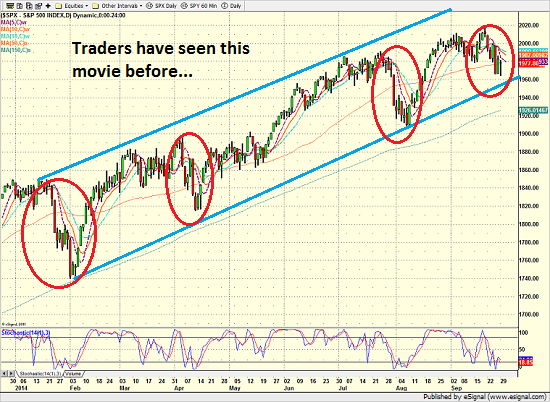
At this point no one should get too excited just yet as we have been here before. Four times, just in 2014, the markets dipped and the BTFDers jumped in and the averages continued on their merry way. With that bit of information, may I point out that the bottom trend line (blue) is at 1960 for the SP500 and we are there now!
Daily State Of The Markets: Traders Have Seen This Movie Before
In short, it appears that traders have seen this movie before. They’ve seen this scenario play out over and over and over again in the last few years. And by now, pretty much everyone knows that the hero doesn’t die in the end. And everyone also knows that the battle cry to making money in this market is to “just buy the freaking dip!”
Take a look at the chart below. From a technical perspective, that trend channel is a thing of beauty, is it not?
The problem is that this type of trading behavior can’t last forever. At some point, perhaps soon, something will come along to scare traders out of the #BTFD mentality. Something will become a catalyst. Something will change the game.
The medium term indicators are leaning towards the fractionally bullish side at the midday and the short-term market direction meter is neutral. We remain mostly, at best, neutral and conservatively holding. The important DMA’s, volume and a host of other studies have not turned significantly and that is not enough for me to start shorting, but now I am getting very concerned. The SP500 MACD has turned down, but remains below zero at -2.77. I would advise caution in taking any position during this uncertain period although some technical indicators have starting to turn bearish.
Investing.com members’ sentiments are 72 % Bearish and it seems to be a good sign for being bullish. The ‘Sheeples’ always seem to get it wrong.
Investors Intelligence sets the breath at 53.3 % bullish with the status at Bear Confirmed. (Chart Here )
StockChart.com NYSE Bullish Percent Index ($BPNYA) is at 55.89. (Chart Here) Below support zone and apparently going further down. Next stop was ~57 and now it is ~44, below that is where we see the markets crash.
StockChart.com S&P 500 Bullish Percent Index ($BPSPX) is at 66.40. (Chart Here) In support zone and falling – doesn’t look good.
StockChart.com 10 Year Treasury Note Yield Index ($TNX) is at 24.14. (Chart Here) Treasury Yield Curve Approaches Flattest Since 2009.
StockChart.com Overbought / Oversold Index ($NYMO) is at -50.64. (Chart Here) But anything below -30 / -40 is a concern of going deeper. Oversold conditions on the NYSE McClellan Oscillator usually bounce back at anything over -50 and reverse after reaching +40 oversold.
StockChart.com Consumer Discretionary ETF (XLY) is at 66.15. (Chart Here)
Chris Ciovacco says, “As long as the consumer discretionary ETF (NYSEARCA:XLY) holds above [66.88], all things being equal, it is a good sign for stocks and the U.S. economy.” This chart clearly shows that dropping below 65.50 should be of a great concern to bullish investors.
This $NYA200R chart below is the percentage of stocks above the 200 DMA and is always a good statistic to follow. It can depict a trend of declining equities which is always troubling, especially when it drops below 60% – 55%. Dropping below 40%-35% signals serious continuing weakness and falling averages.
Today it represents the lowest levels seen since the beginning of the October, 2011 rally. Eric Parnell says, ‘ If nothing else, given that relatively fewer stocks are trading above their 200-day moving average at a time when the market is just off of its all-time highs suggests that an increasingly narrowing group of stocks is driving the rally at this stage, which does not bode well for the future sustainability of the uptrend.” It also strongly suggests there has been a ‘stealth bear market’ underway in recent months.
StockChart.com NYSE % of stocks above 200 DMA Index ($NYA200R) is at 47.07 %. (Chart Here) Unless this downward trend reverses itself soon, we are going to see further downside
The DOW at 12:15 is at 16870 down 173 or -1.02%. (the Dow is only up 2.2% in 2014)
The SP500 is at 1957 down 15 or -0.76%.
SPY is at 195.49 down 1.53 or -0.79%.
The $RUT is at 1094 down 8 or -0.70%. (the Russell is now down -5.5% on the month and -4.5% on the year)
NASDAQ is at 4444 down 49 or -1.09%.
NASDAQ 100 is at 4003 down 45 or -1.12%.
How the Popular ‘VIX’ Gauge Works
$VIX ‘Fear Index’ is at 16.59 up 0.28 or 1.72%. neutral Movement
(Follow Real Time Market Averages at end of this article)
The longer trend is up, the past months trend is net negative, the past 5 sessions have been negative and the current bias is negative.
WTI oil is trading between 92.94 (resistance) and 91.22 (support) today. The session bias positive and is currently trading up at 92.74. (Chart Here)
Brent Crude is trading between 96.18 (resistance) and 94.54 (support) today. The session bias positive and is currently trading up at 95.78. (Chart Here)
Why Gold Will Rise When The Dollar Falls
– and –
The general consensus is that gold prices will actually fall in the next twelve months (Sept to Aug. 2015). Goldman Sachs estimates that gold will fall to $1,050 an ounce, a drop of nearly 19%.
Gold rose from 1205.28 earlier to 1219.87 and is currently trading up at 1218.50. The current intra-session trend is positive. (Chart Here)
Currency Corruption Weighs on Copper
Dr. Copper is at 3.026 falling from 3.048 earlier. (Chart Here)
The US dollar is trading between 86.29 and 85.88 and is currently trading down at 86.00, the bias is currently negative and volatile. (Chart Here) Resistance made in Aug., 2013 has been broken.
The markets are still susceptible to climbing on ‘Bernankellen’ vapor, use caution!
“Investors should remember that excitement and expenses are their enemies. And if they insist on trying to time their participation inequities, they should try to be fearful when others are greedy and greedy only when others are fearful.” – Warren Buffett
If you would like to get advanced buy/sell tweets, sign-up in the column to the right of this post by clicking on the ‘Follow‘ button. Write me with suggestions and I promise not to bite.
Real Time Market Numbers
To contact me with questions, comments or constructive criticism is always encouraged and appreciated:
Written by Gary


