Written by Gary
Closing Market Commentary For 09-30-2014
DOW closes in the green, SP500 and NASDAQ close in the red and below their 50 DMA’s, all on low volume. Today marks another crazy trading day in the Land Of Non-Sequitur Financial Guidance.
By 4 pm the averages were mostly in the red as the neither the bulls or the bears have a clue what is going to happen next.

What is supposed to happen or at lest ‘likely’ to happen is far from reality. Unable to tell which way Mr. Markets is going to take us as most signals tell a woeful story of bears and deep gullies, but that doesn’t necessarily mean anything. The most likely scenario is that we will see another do-nothing session, little volatility and directionless.
The medium term indicators are leaning towards the hold side at the close and the short-term market direction meter is very bearish. We remain mostly, at best, neutral and conservatively holding. The important DMA’s, volume and a host of other studies have not turned significantly and that is not enough for me to start shorting, but now I am getting very concerned. The SP500 MACD has turned flat, but remains below zero at -0.39. I would advise caution in taking any position during this uncertain period although some technical indicators have starting to turn bearish.
Investing.com members’ sentiments are 74 % Bearish and it seems to be a good sign for being bullish. The ‘Sheeples’ always seem to get it wrong.
Investors Intelligence sets the breath at 54.4 % bullish with the status at Bear Confirmed. (Chart Here )
StockChart.com NYSE Bullish Percent Index ($BPNYA) is at 57.50. (Chart Here) Below support zone and apparently going further down. Next stop ~57 and then ~44, below that is where we see the markets crash.
StockChart.com S&P 500 Bullish Percent Index ($BPSPX) is at 68.60. (Chart Here) In support zone and testing.
StockChart.com 10 Year Treasury Note Yield Index ($TNX) is at 25.08. (Chart Here) Treasury Yield Curve Approaches Flattest Since 2009.
StockChart.com Overbought / Oversold Index ($NYMO) is at -45.32. (Chart Here) But anything below -30 / -40 is a concern of going deeper. Oversold conditions on the NYSE McClellan Oscillator usually bounce back at anything over -50 and reverse after reaching +40 oversold.
StockChart.com Consumer Discretionary ETF (XLY) is at 66.70. (Chart Here)
Chris Ciovacco says, “As long as the consumer discretionary ETF (NYSEARCA:XLY) holds above [66.88], all things being equal, it is a good sign for stocks and the U.S. economy.” This chart clearly shows that dropping below 65.50 should be of a great concern to bullish investors.
StockChart.com NYSE % of stocks above 200 DMA Index ($NYA200R) is at 49.88 %. (Chart Here) Not a good sign when half of the equities on the NYSE is BELOW their 200 DMA. Unless this downward trend reverses itself soon, we are going to see further downside.
According to StockTiming, Last week (09-8-2014) they reported that the $NYA Index was within just a few tenth’s of 1% from its all time high. Last Friday the $NYA Index was at 10911.39 which was 162.01 points lower than where it was on September 5th.
Last week, they commented that the Fed couldn’t afford to let the market die, so they were pumping in a lot of Liquidity to keep things up. By Friday, they had not pumped in enough so the Inflowing Liquidity levels were dropping.
While the level of Inflowing Liquidity was lower and down trending, it was still in positive territory so the Fed could still turn things back up. The liquidity expansion / contraction line is at ~10600.
StockChart.com NYSE Composite (Liquidity) Index ($NYA) is at 10117.43. (Chart Here)
Guideposts For An Indecisive Stock Market
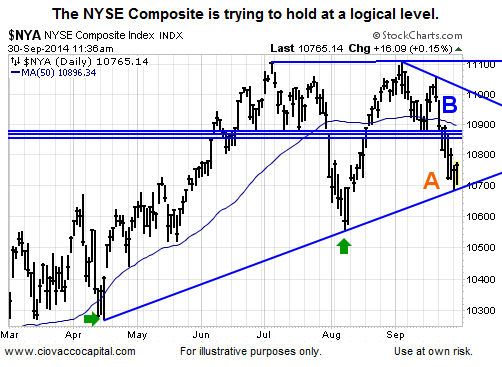
. . . the broader equity market is showing some “pay attention” signals, along with deteriorating market breadth. On the bullish side of the ledger, the longer-term charts still look good and we know an open mind is required when the S&P 500 (NYSEARCA:SPY) is hovering near a flat 50-day moving average (as it is now).
Therefore, drawing lines in the sand can help us balance the need to be patient with the need to protect capital in the event of ongoing weakness. In the short-term, if Monday’s lows are taken out, it increases the odds of additional weakness in stocks (see point A below). The odds of good things happening short-term will increase if the NYSE Composite can close above its 50-day (near point B).
The DOW at 4:00 is at 17043 down 28 or -0.17%. (the Dow is only up 2.2% in 2014)
The SP500 is at 1972 down 5.51 or -0.28%.
SPY is at 196.94 down 0.52 or -0.26%.
The $RUT is at 1102 down 16 or -1.45%. (the Russell is now down -5.5% on the month and -4.5% on the year)
NASDAQ is at 4493 down 12 or -0.28%.
NASDAQ 100 is at 4049 up 2 or 0.06%.
How the Popular ‘VIX’ Gauge Works
$VIX ‘Fear Index’ is at 16.31 up 0.33 or 2.07%. Bearish to Neutral Movement
(Follow Real Time Market Averages at end of this article)
The longer trend is up, the past months trend is net neutral, the past 5 sessions have been down and the current bias is negative.
WTI oil is trading between 94.90 (resistance) and 99.93 (support) today. The session bias is negative, quiet and is currently trading up at 91.46. (Chart Here)
Brent Crude is trading between 97.80 (resistance) and 94.38 (support) today. The session bias is negative and is currently trading up at 94.88. (Chart Here)
Why Gold Will Rise When The Dollar Falls
– and –
The general consensus is that gold prices will actually fall in the next twelve months (Sept to Aug. 2015). Goldman Sachs estimates that gold will fall to $1,050 an ounce, a drop of nearly 19%.
Gold rose from 1205.01 earlier to 1220.51, reversed course and is currently trading up at 1209.80. The current intra-session trend is negative and volatile. (Chart Here)
Currency Corruption Weighs on Copper
Dr. Copper is at 3.010 falling from 3.060 earlier. (Chart Here)
The US dollar is trading between 86.34 and 85.62 and is currently trading down at 86.03, the bias is currently net positive and trading sideways. (Chart Here) Resistance made in Aug., 2013 has been broken.
The markets are still susceptible to climbing on ‘Bernankellen’ vapor, use caution!
“Investors should remember that excitement and expenses are their enemies. And if they insist on trying to time their participation inequities, they should try to be fearful when others are greedy and greedy only when others are fearful.” – Warren Buffett
If you would like to get advanced buy/sell tweets, sign-up in the column to the right of this post by clicking on the ‘Follow‘ button. Write me with suggestions and I promise not to bite.
Real Time Market Numbers
To contact me with questions, comments or constructive criticism is always encouraged and appreciated:
Written by Gary


