3:30 A little more than 30 minutes to go and caution reigns high as the 500 moves in lower numbers as it goes below 1344, currently at 1341 and low as 1340, all on light volume. Will it stay below this support ‘line in the sand’ and signal the bears to come in and take over or does the low volume tell you something else, like a bear trap in the making. There is some of the cash crowd taking profits as can be seen by slightly elevated volume, but the jury is still out on any meaningful justification of today’s move lower.
Friday we see the NFP reports and if Greece actually does NOT default we could easily reverse the fall today and make it meaningless. Except for those, of course, who decided to jump ship and those who bought up some shorts. Today was not the right time as indicated by the very small point movements of the ETF’s as pointed out in an earlier blog today. The caution flag is out and everything is moving in slow motion while the charts are being groomed for the next move.
————–
3:00 Here is an interesting article and graph indicating a pull back on SPY.
S&P Target: [SPY] 182 By May 2014 by Simit Patel
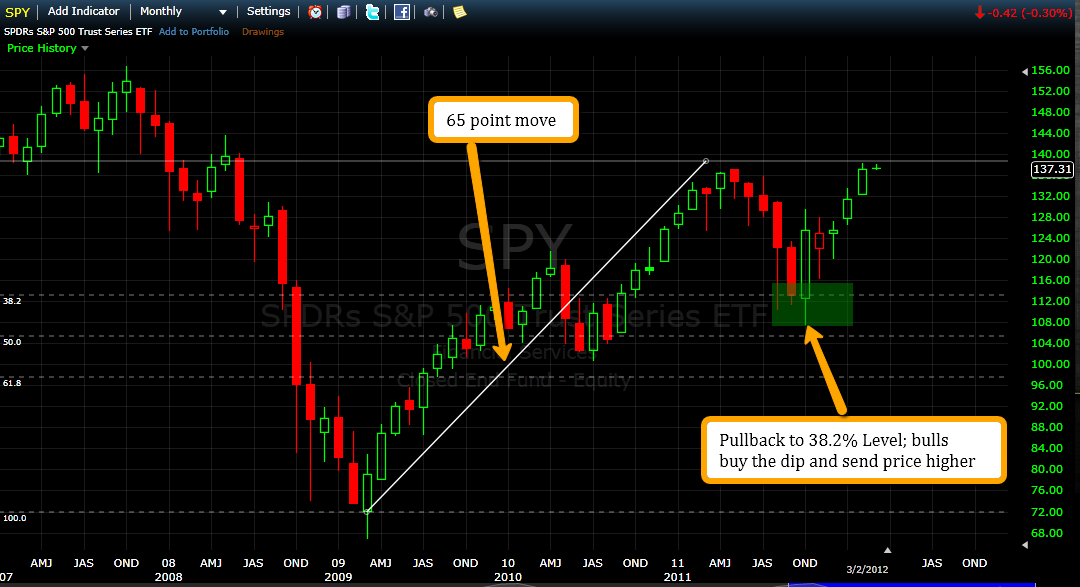
” For this, it helps to look at a chart of the S&P 500 (SPY).
Here we see the market rallied from 72 to 137 — a move of about 65 points — from March 2009 to May of 2011. The market then retraced until we December, at which point a bullish engulfing candlestick pattern formed at the 38.2% Fibonacci retracement level — a key sign that a reversal was brewing.”
————–
Betting the markets will continue the correction tomorrow.
2:30 Before you throw in the towel remember the old saying that gaps will be covered sooner or later. Here is on that just might get covered “sooner” by Friday when the NFP is announced and for sure if the Greeks don’t default. My plan is to go long tomorrow thinking that the markets will continue the “correction” before rising later in the day.
(SP500 10 min chart-from closing 3-5 to opening 3-6)
Oh, then there are those French Banks that are probably going to have little problem of all that Greek debt they are holding – so maybe I am wrong!
————–
2:00 Read in the Telegraph.
@telegraph: “Last month, Morgan Stanley noted January’s unusual broad rise in assets, with riskier assets such as equities rising alongside safe havens like gold. Its conclusion? “This much cross asset optimism is usually a bad sign“.
A reminder from our blog on February 22:
While we’re all aware that we’ve just witnessed the best start to the year in equities since 1994, what was more interesting to us was the sheer breadth of positive performance across a wide array of assets.
Effectively, the only major asset to fall in value in January was the dollar, and the only other laggards we could see were corn, coffee, coal and natural gas. … and has often preceded equity market corrections.
As shown in Exhibit 1 (above), January 2012 was only the fifth month in the past five years when all four of these major asset classes have risen in unison. More interesting, on three of these four prior occasions that month proved to be a significant peak in equities and was followed by a substantial double-digit decline. “
Written by Gary


