More Upside Potential This Week, However…
by Cliff Wachtel, FX Empire
FX Traders’ weekly EURUSD technical picture per Indexes, EURUSD monthly, weekly, daily charts. See Part 2 On The Fundamentals, And How They’ll Decide The Coming Medium Term Breakout From Recent Range Trading
The following is a partial summary of the conclusions from the fxempire.com weekly analysts‘ meeting in which we cover outlooks for the major pairs for the coming week and beyond.

Summary
- Per Weekly Stock Indexes: Medium term risk appetite still supportive of the EURUSD, but weakening.
- EURUSD Monthly Technical Outlook: Conflicted -Bearish Wedge, Strong Resistance Versus Bullish Momentum-Fundamentals Suggest Bearish Resolution
- EURUSD Weekly Chart Outlook: Bullish Upward Momentum Vs. Bearish Weakening Momentum And Strong Resistance At 1.40
- EURUSD Daily Technical Outlook: Tight Range Trade With More Upside Than Downside Likely This Week
TECHNICAL OUTLOOK
First we look at overall risk appetite as portrayed by our sample of global indexes, because the EURUSD has been tracking these fairly well recently.
Overall Risk Appetite Per Weekly Charts Of Leading Global Stock Indexes
Most indexes recouped most or all of the prior week’s losses. In other words, support held. As we predicted last week, so far we’ve just a minor normal bull market pullback in risk appetite.

EURUSD WEEKLY OUTLOOK PART 1: TECHNICAL PICTURE – More Upside Potential This Week, However…
Weekly Charts Of Large Cap Global Indexes With 10 Week/200 Day EMA [DATES] In Red: LEFT COLUMN TOP TO BOTTOM: S&P 500, DJ 30, FTSE 100, MIDDLE: CAC 40, DJ EUR 50, DAX 30, RIGHT: HANG SENG, MSCI TAIWAN, NIKKEI 225
Key For S&P 500, DJ EUR 50, Nikkei 225 Weekly Chart: 10 Week EMA Dark Blue, 20 WEEK EMA Yellow, 50 WEEK EMA Red, 100 WEEK EMA Light Blue, 200 WEEK EMA Violet, DOUBLE BOLLINGER® BANDS: Normal 2 Standard Deviations Green, 1 Standard Deviation Orange.
Source: MetaQuotes Software Corp, www.fxempire.com, www.thesensibleguidetoforex.com
16 Apr. 18 18.33
Index Weekly Charts Key Points: Support Holds, Uptrends Intact But Losing Momentum: Still Bullish
Overall the medium term uptrends are intact (Hong Kong and Japan the obvious exceptions).
That said, the momentum indicators on the weekly charts continue to weaken, as most of our sample leading global stock indexes have been flat since early December.
-They’ve closed in their double Bollinger band neutral zone, implying no strong trend up or down, range trading ahead.
-The EMAs are flattening.
Conclusion: Risk appetite over the medium term is still drifting higher. That’s still bullish for the EURUSD, which tends to rise or fall with risk appetite. However the weakening momentum means that risk appetite could soon cease to support the pair.
EURUSD Monthly Technical Outlook: Conflicted -Bearish Wedge, Strong Resistance Versus Bullish Momentum
We’ve a typical set of conflicting indicators. Long term momentum still firmly bullish, but strong overhead resistance and bearish wedge counter that. A breakout is coming, but in which direction? For that answer we look to the likely longer term fundamentals that will drive the price action over the longer term. See Part 2.
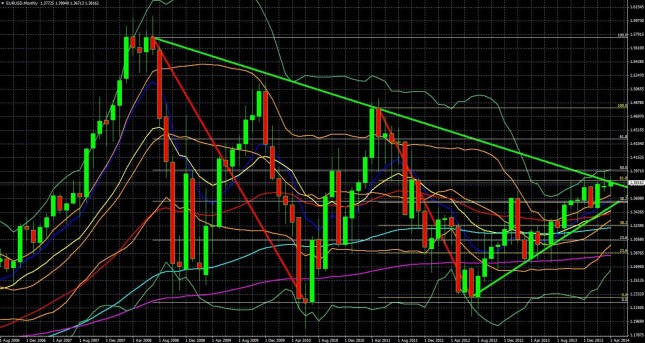
EURUSD Monthly Chart August 2006 – Present. Long term bearish wedge suggests a breakout coming. See fundamentals section for predicted direction of that breakout.
KEY: 10 Week EMA Dark Blue, 20 WEEK EMA Yellow, 50 WEEK EMA Red, 100 WEEK EMA Light Blue, 200 WEEK EMA Violet, DOUBLE BOLLINGER BANDS: Normal 2 Standard Deviations Green, 1 Standard Deviation Orange. The yellow Fibonacci retracement covers the range of the last major downtrend of May 2011 to August 2012. The white fib retracement covers the longer term downtrend from July 2008 to June 2010. The red downward diagonal lines show the range of the downtrend that is being retraced as price moves higher.
Source: MetaQuotes Software Corp, www.fxempire.com, www.thesensibleguidetoforex.com
09 Apr. 18 14.27
Key Points To Note
MEDIUM TO LONGER TERM BEARISH
Notice the wedge formed by the long term EURUSD downtrend and the medium term uptrend, which implies a coming breakout as bullish or bearish forces prevail. The more established, longer term downtrend suggests a break lower over the longer term.
As noted elsewhere in this post, the balance of other technical indicators (low volatility, strong resistance at 1.40 backed by a 61.8% fib retracement level (yellow) and a longer term 50% fib retracement level (white) ECB verbal intervention at that level) and fundamental evidence (ECB moving to ease while Fed moving to tighten over medium term) also paints a bearish picture for the EURUSD in the medium to longer term.
That said, the bearish technical outlook is not overwhelming.
-The shorter uptrend is about 2.5 years old and so deserves respect.
-1.40 Support/Resistance level has been breached many times in the past years, though we’d need a new bullish fundamental driver OR longer than expected continued unchanged ECB and Fed policy.
EURUSD Weekly Technical Outlook: Bullish Upward Momentum Vs. Bearish Weakening Momentum And Strong Resistance At 1.40
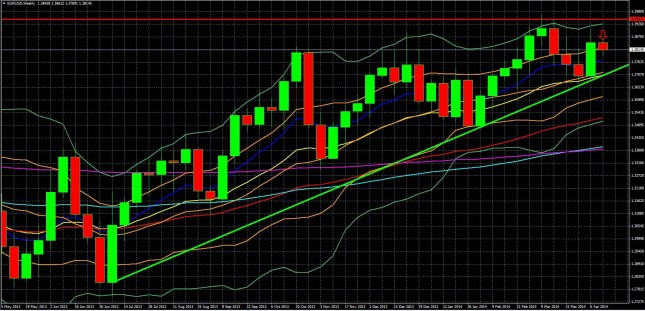
EURUSD Weekly Chart May 2013 – Present
KEY: 10 Week EMA Dark Blue, 20 WEEK EMA Yellow, 50 WEEK EMA Red, 100 WEEK EMA Light Blue, 200 WEEK EMA Violet, DOUBLE BOLLINGER BANDS: Normal 2 Standard Deviations Green, 1 Standard Deviation Orange
Source: MetaQuotes Software Corp, www.fxempire.com, www.thesensibleguidetoforex.com
17 Apr. 18 18.50
Key Points To Note
These are similar to monthly chart.
BULLISH
-The pair is still in the double Bollinger Band buy zone, though just barely – so upward momentum is more likely to continue.
-EMAs flattening out, so momentum is weakening, which makes sense given that we saw the same thing on the weekly charts of the global stock indexes with the EURUSD generally tracks.
Support of the uptrend line (green) has held again. There is little near term downside risk with strong support near 1.38 (see daily chart analysis below).
BEARISH
-Stiff resistance nearby at 1.40 (with help from ECB jawboning, which worked on Monday).
-Wedge pattern suggests a breakout is coming. Fundamentals discussed below have clear likely direction for the medium term.
EURUSD Daily Technical Outlook: Tight Range Trade With More Upside Than Downside Likely This Week
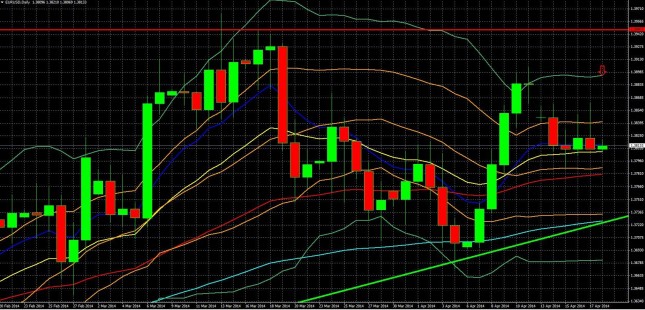
EURUSD Daily Chart February 20 – Present: More range trading likely
KEY: 10 Week EMA Dark Blue, 20 WEEK EMA Yellow, 50 WEEK EMA Red, 100 WEEK EMA Light Blue, 200 WEEK EMA Violet, DOUBLE BOLLINGER BANDS: Normal 2 Standard Deviations Green, 1 Standard Deviation Orange
Source: MetaQuotes Software Corp, www.fxempire.com, www.thesensibleguidetoforex.com
18 Apr. 18 19.03
KEY TAKE-AWAYS DAILY CHART: Tight Range Trading
The Bearish
Month-Long Downtrend: The pair has been in a downtrend since March 19, which became more entrenched with Monday’s gap lower (on ECB verbal intervention – warnings that the EUR was too high) that created a second lower high.
Lacks Momentum To Resume Uptrend: The pair spent the rest of the week firmly in the double Bollinger® band neutral zone.
Traders Undecided: Confirming the neutral momentum were 4 straight doji-type candles (small bodies relative to their tails). This candle shape suggests indecision – after lots of price movement price ends the day almost unchanged.
The Bullish: Strong support likely to limit further downside
The 1.380 support level, bolstered by
-The 20 day EMA (yellow) and
-The 38.2% Fibonacci retracement level seen on the monthly chart above
-The 50 day EMA (red) just below around1.378
Meanwhile, resistance on this daily chart is in the highs of last week, around 1.381, with tests of up to around 1.3830.
CONCLUSIONS FOR THE COMING WEEK TECHNICAL OUTLOOK
In sum, tight range trading is likely in the coming week per our technical indicators. The likely trading range for the coming week should be within the 1.3850 – 1.3780. That said, there is little upside resistance before 1.390 if we get a strong risk-on week, which is a distinct possibility
– Traders return from holiday weekends ready to trade
-They just need an excuse from fundamentals. See Part Two for more on those., and out full conclusion that combines both technical and fundamental considerations.
To be added to Cliff’s email distribution list, just click here, and leave your name, email address, and request to be on the mailing list for alerts of future posts.
DISCLOSURE /DISCLAIMER: THE ABOVE IS FOR INFORMATIONAL PURPOSES ONLY, RESPONSIBILITY FOR ALL TRADING OR INVESTING DECISIONS LIES SOLELY WITH THE READER.


