by Salil Mehta, Statistical Ideas
How significant to you is it that Wall Street strategists have lowered their equity market forecasts, from mid-double digit returns for 2013, to now mid-single digit returns for 2014? It turns out that it is worth a lot less than you might think.

Equity-return modeling generally incorporates estimating the average trend in economic factors, and then assigning a price multiple to that future trend (the new price multiple almost always anchored within 1 or 2 of the current multiple). To add some complexity, in the recent bull market leading up to the 2008-2009 financial crisis, Wall Street firms opened up this single-point price targets. Some major firms now offer binomial path outcomes instead. So a bull case, and a bear case scenarios, with a probability assigned to each.
While most people including the strategists themselves do not focus on such important details (e.g., none forecasted a recession, let alone financial crisis, as a bear case in 2008), either these probabilities could be risk-adjusted so that the future price can be extrapolated using a risk-neutral investor approach, or the actual probabilities could stay in absolute terms and an appropriate risk rate could be used to determine the future price target(s). But leaving this whole complication aside, the point here is that the major source of uncertainty among Wall Street forecasters remains on what the price multiple should be on the future earnings trend (and this assumes they don’t en masse completely blow the macro call). Are they generally optimistic or generally pessimistic can account for a large explanation of the generally, double-digit difference in the higher year-end targets versus the lower year-end targets. If the current multiple is, for example 15, and a pessimist anticipate a 0.5 change and an optimist estimated a 2.0 change, then this 1.5 difference is 10% of the original 15. This is an important idea, as we uncover an additional 12%-or-so spread that risk mis-timing forces onto things.
The core, middle-of-the-pack, entered this year looking for a single-digit return in 2014. Of course as any long-term strategist outside of Wall Street would note, the end of 2014 is quite an arbitrarily brief period of time. And these net returns just take into account a long-run average amount of risk within that period (e.g., 2014). Of course this masks an ugly truth about the nature of risk, which is that it doesn’t occur in the same way and timeframe as the economic return factors that monopolize the intellectual demands of Wall Street analysts.
Now let’s take for example that the major risks implicit in each calendar year is one 10% correction, and two 5% corrections. Or 20% annual total (40% biennial). But in reality these corrections will happen when they choose, are calendar agnostic, and do not conform to the smooth parameters of economic growth extrapolations.
Looking at the probability of the risk convolutions for any one given year, we can suggest the other combinations that can play out in our hypothetical scenario of 40% biennial risk. Namely look at these other examples, which can occur in 2014 and 2015 (including in reverse order, so that either year could be Year A, and the other be Year B). Any event that shifted from Year A, to Year B, is underlined. The probabilistic weight is provided above each combination. And the ordering of the risk events in any given year is irrelevant:
1/4 weight
Year A –> -10%, -5%, -5%
Year B –> -10%, -5%, -5%
1/3 weight
Year A –> -10%, -5%
Year B –> -10%, -5%, -5%, -5%
1/4 weight
Year A –> -5%, -5%
Year B –> -10%, -5%, -5%, -10%
1/6 weight
Year A –> -10%
Year B –> -10%, -5%, -5%, -5%, -5%
What we see here is the finicky nature of how year-end targets can unravel based solely on the independent displacement of major risk events, relative to the end of the calendar year. A recent example of this is the suppression of a correction in the equity markets at the end of 2013 (creating a gap in the actual 2013 stock market return versus Wall Street forecasters who themselves were caught shooting-in-the-dark as they erratically changed their full-year forecasts throughout 2013). And alas, the correction initiated precisely in January 2014. Of course these large forecasting gaps can equally go in either direction.
The weights and the distributions of the risk events shown above yield a 6% standard deviation (σ). Or an interquartile range (75th percentile – 25th percentile) that is usually mathematically higher than 12%. So the timing of risk we just showed creates just as much independent uncertainty, as the inherent growth model uncertainty, between the higher price target forecasters versus the lower price target forecasters!
Now let’s see, in the illustration below, a scaled version of what a 2014 forecast for a 5% rise in equity markets really looks like based just on risk timing. A few forecasts are shown, and the along vertical axis we see the typical deviation we have on that annual forecast from just the timing of risk. Sure something near a 5% return in 2014 can happen; though there is a very strong likelihood that you’ll see nothing close to this. You may easily see a negative return. Conversely you can see a double-digit return.
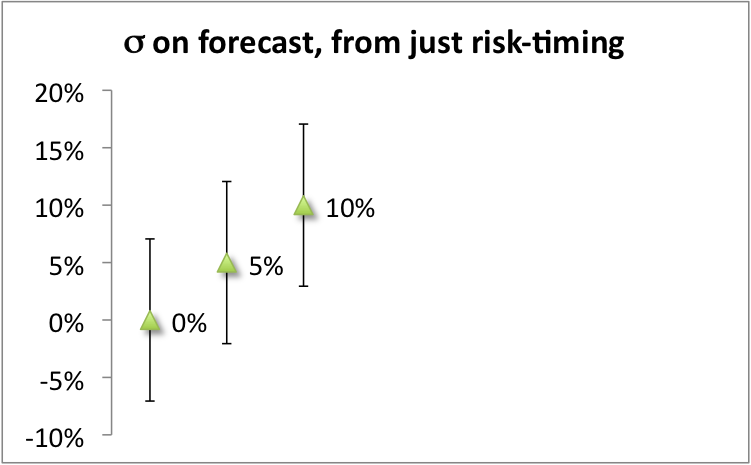
Even if the return were mid single-digits, we know this is also within a one σ range of other true return patterns, such as that for a 0% return or a 10% return. Or if we include the uncertainty beyond risk mis-timing, then this is only within a half σ range, or within a one σ range of either -5% and 15% returns. So not much is truly known about the equity returns when considering the multiple sources of error uncertainty. When Wall Street strategists start the year by providing a lower return forecast, they’ve added very little helpful information for long-term asset allocators.
This is due to the current lack of Wall Street discussion of risk modeling into calendar-year investment projections. But similar to the trend in providing a broader distribution of rankings and binomial paths, perhaps this knowledge will one day enter the mainstream. For now though, those who partake in these quirky rituals of utilizing full year targets for important long-term, investment decision making could heed the quote of the 19th century social reformer, Robert Owens:
All things I thought I knew; but now confess
The more I know, I know, I know the less.


