from Zillow
In a competitive world, including the current housing market, what we want often takes a back seat to what we can get. Faced with rising rents, tight credit and scant numbers of homes for sale, how we live is largely determined by what’s made possible by both the market and our pocketbooks.

Retirees trying to sell their empty nest, for example, may struggle to find their next home when inventory is tight, and so they may stay put a little longer. A young couple looking to buy their first home may not have good enough credit to qualify for a mortgage, and so they stay renters a little longer. A worker gets a job far across town, but after years living in the same apartment with only modest rent increases, current market-rate rents may seem extravagant. So, he stays a little longer.
A recent Gallup poll revealed that 33 percent of U.S. residents would move to a different state if the opportunity presented itself, but for millions of Americans, moving is a luxury. Zillow examined how long working-age [1] households have remained in their current home, both by income (divided into three equal buckets [2]) and by whether or not the household owns or rents (figure 1).
Regardless of income, renters are far more transient than owners. Within every income tier, almost half of renter households have lived in their current home for less than two years. This makes some sense. One of the best reasons to rent is if you don’t plan on living in a home long enough to recoup the large, upfront costs associated with buying a home. A recent Zillow survey found that one in six renters say the primary reason they rent is because of life uncertainty.
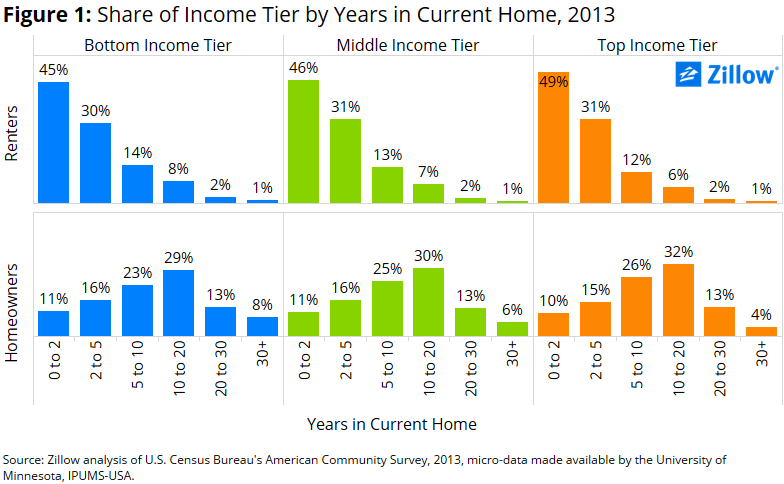
As renters step up the income ladder, they become even more mobile. For example, 45 and 30 percent of households with more modest, bottom-tier earnings have lived in their current home for less than two or for two to five years, respectively. These shares increase to 49 and 31 percent among top-tier earners, who are more likely to rent because they prefer to rent, and not because owning is a financial hurdle. Higher-earning renters may prefer to stay more mobile.
But while lower-tier earners stay in homes for longer periods, they keep jobs for shorter terms. Lower-income earners stay in their jobs a median of 4.7 years, compared to 7.8 and 10.8 years, respectively, for middle and top-tier earners [3].
Weathering the Storm
Among homeowners, as income grows, more people stay in their homes for five to 10 years and 10 to 20 years. This could be because of the greater concentration of foreclosures among lower-income homeowners during the recent foreclosure crisis, which would increase the share of lower-income households forced to move and inflate the share living in their current homes for less than five years. Bulwarked by greater savings, more affluent owners more likely bought their homes with larger down payments and rarely took advantage of the somewhat dubious mortgage products prevalent during the housing boom. Because they were more financially sound, they were better able to weather the storm of the housing bust, even if they lost a job.
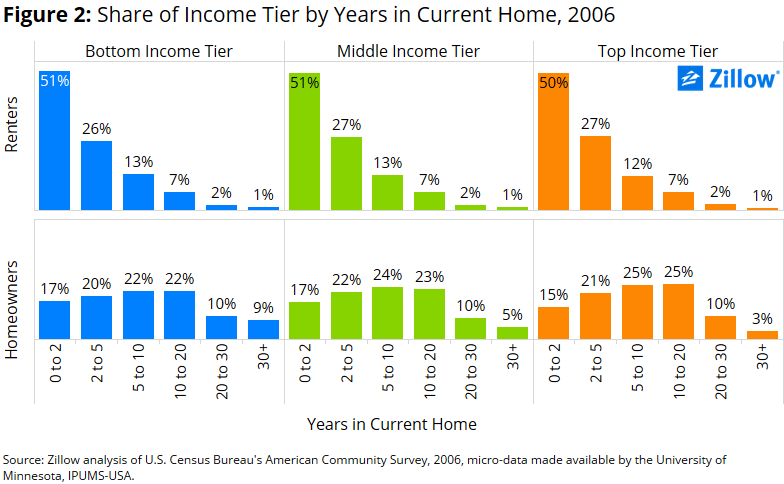
But this same pattern – in which lower-income households stay in their homes for very short terms or very long terms, relative to higher-income groups – can also be found in 2006, before the crisis (figure 2). Age often plays a big role in determining income differences among homeowners. Lower-income homeowners are likely to be clustered at both ends of the age distribution. For young households making entry-level salaries, their higher mobility could simply be a product of not being old enough to have owned a home for more than five years. Conversely, lower-income homeowners with very low mobility could be retirees [4] earning a pension and living in a home for many years after having paid off a mortgage, or could be low-income households who inherited a home and don’t move for lack of means.
While the differences between income groups are similar between 2013 and 2006, the level of homeowner mobility is not. In 2006, mobility was high, as rising homeownership rates in turn helped drive the bubble itself, only to fall again a few years later. The mobility of renters today is also down compared to 2006, perhaps because of the rising rental affordability crisis, which could keep some renters locked-in with their current landlord. Another cause may be the increasing median age of renters, as younger renters delay marriage and having children, which also puts off homeownership.
There are a wealth of possible explanations for why renters and homeowners of all incomes choose to move or not move, whether related to the housing bubble and bust, evolving demographics and/or the rising rental affordability crisis. Mobility is sometimes a choice and sometimes not, but in current housing markets, a lower income undoubtedly means fewer choices.
Footnotes:
[1] Source: Zillow analysis of U.S. Census Bureau’s Current Population Survey, 2012 Job Tenure Supplement, micro-data made available by the University of Minnesota, IPUMS-USA.
[2] We exclude the over-65 age group to reduce this influence.
[3] We’ve removed households headed by those 65 years old and older from the sample in order to reduce the influence of retirement incomes on our analysis.
[4] We create the income tier groups by equally dividing households within each major metropolitan area into three equally sized groups. The lower tier income group is then composed of all households whose incomes fall in the bottom third of their metros. Households outside of metropolitan areas are not included.
Source:
http://www.zillow.com/research/income-and-mobility-9650/
About the Author
Skylar Olsen is a Senior Economist at Zillow. To learn more about Skylar click here.


