by Bill Dupor – The Regional Economist, Federal Reserve Bank of St. Louis
The ability of the Federal Reserve to stimulate the economy through monetary policy has been hampered in recent years because the federal funds rate, the Fed’s primary policy instrument, has been effectively “stuck” at zero. Once reached, the “zero lower bound” limits a central bank’s ability to provide additional monetary stimulus. In this situation, fiscal policy takes center stage as a potential tool to combat an economic downturn.

Stimulative fiscal policy consists of lowering taxes, increasing transfers to individuals, increasing government purchases, or some combination of the three. The federal government pursued all three of these strategies as part of the American Recovery and Reinvestment Act of 2009 (ARRA). The law’s total price tag was $840 billion, making it the largest countercyclical fiscal intervention in the U.S. since FDR’s New Deal.
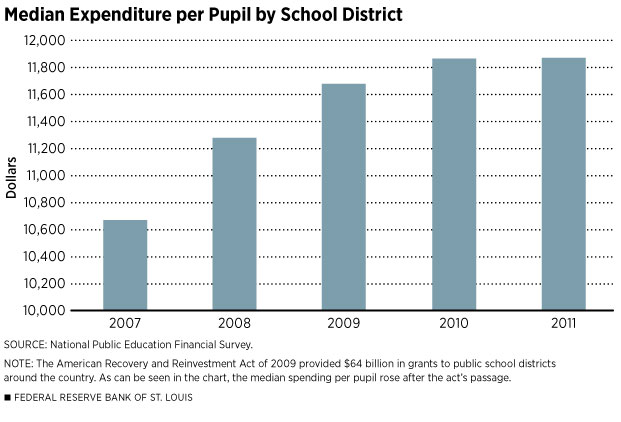
A large share of the ARRA’s funding was made as grants to state, local and other governments below the federal level, as well as to public institutions. Public school districts were one of the largest groups of these recipients, receiving over $64 billion in Department of Education ARRA dollars. This injection of funds translated into greater spending at the district level. The figure displays the median value of total expenditures relative to enrollment for public school districts by school year. As the figure indicates, expenditures per pupil rose substantially following the act’s passage.
Moreover, the ARRA’s education component has been touted as one of the success stories by supporters of the law. For example, according to the Executive Office of the President in 2009, “The rapid distribution of SFSF [State Fiscal Stabilization Fund] funding helped fill the gaps and avert layoffs of essential personnel in school districts and universities across the nation.”
The three immediate goals of the act were:
• to create new jobs and save existing ones,
• to spur economic activity and invest in long-term growth, and
• to foster unprecedented levels of accountability and transparency in government spending.
As a bonus for researchers, the ARRA provided a great deal of detailed data to analyze the effectiveness of countercyclical fiscal policy.
A Research Challenge
From a public policy perspective, it is important to quantify the effects of the ARRA’s components, including education. To answer this question for the act’s education component, one must address the counterfactual: What would school districts have done with spending and hiring decisions in absence of the act’s funds? M. Saif Mehkari, a University of Richmond economics professor, and I answered this question in a study this year by exploiting the heterogeneity in how these ARRA grant dollars were allocated across school districts, that is, how did districts that were receiving relatively little grant money adjust their spending choices relative to districts receiving plenty of grant money? From this comparison, Mehkari and I inferred how all districts would have performed had ARRA funds not been available.
To conduct this study, we used data on expenditures, both ARRA and non-ARRA revenue, and staffing levels for over 6,700 school districts from both before and during the ARRA period. We found that, during the first two years following the act’s passage, each $1 million of grants to a district increased education employment by 1.5 persons relative to a no-stimulus baseline.[1] Moreover, all of this increase came in the form of nonteaching staff. The jobs effect was also not statistically different from zero.
One potential explanation for not changing the number of teachers may be the districts’ own preference for maintaining student-teacher ratios in the classroom. If this was a top priority for district administrators, then even districts with relatively small ARRA grants and large budget gaps may have found ways to meet budget shortfalls other than laying off teachers. In fact, surveys of school administrators found that, in response to the recession, administrators took exactly these types of steps, including furloughing personnel, eliminating or delaying instructional improvement initiatives, deferring textbook purchases and reducing high-cost course offerings.[2] The positive, but seemingly small, effect on nonteaching staff may be similarly due to a desire to maintain student-staff ratios at close to their pre-act levels.
Moreover, districts that received relatively generous ARRA grants may have been less willing to hire new staff for risk that, once the short-lived grants were spent, the new staff would need to be let go.
We also found that each $1 million of grants increased expenditures at the district by $570,000 relative to a no-ARRA baseline. Approximately 70 percent of the expenditures took the form of capital outlays, such as construction, land purchases and equipment acquisition. The gap between the two numbers, $430,000, might be accounted for by states’ cutting their own contributions to school districts upon the districts’ receipt of ARRA grants.[3]
Explaining a Puzzle
At first pass, it may seem puzzling that school districts used a substantial part of their grant dollars for capital outlays at a time when the economy was in a deep downturn. To address whether this behavior would be rational on the part of the districts, we developed a model of the dynamic budgeting problem faced by a school district. In the model, a district uses revenue to hire workers and purchase capital, that is, equipment and structures, to provide a flow of educational services over time. The district chooses its inputs to maximize the expected flow of educational services, both now and in the future, that it can generate. The model also assumes that the district can make rational predictions of how much revenue, on average, it will receive in the future, despite considerable levels of uncertainty.
Next, suppose the district receives a one-time injection of funds, such as the ARRA money. The district could choose either to increase employment substantially, causing a temporary improvement in teacher-student and staff-student ratios, or make investments in capital. Interestingly, and perhaps intuitively, the model implies that most of the revenue increase is spent on capital investment because it allows the district to smooth the benefits of additional educational services provided by the capital over many years, benefiting not only today’s students but those in the future. Only a small amount of revenue is used to increase the number of employees in the district.
Thus, the model is capable of explaining two of our empirical findings: the small, but positive, education jobs effect and the relatively large increase in capital expenditures resulting from ARRA grants. Our model does not address the result that districts used only about one-half of their grants on expenditures. In summary, our research shows that the education component of the Recovery Act was only partly successful at boosting spending on public education in the U.S. The extent to which other intergovernmental grants, such as those for high-speed rail and home weatherization, financed by the act actually translated into greater spending on their intended objectives remains an open question.
Source: https://www.stlouisfed.org/publications/regional-economist/april-2015/stimulus-grants-and-schools-how-was-the-money-spent
Endnotes
- In their study, one job refers to one job-year, that is, one year of employment for a person.
- See American Association of School Administrators.
- If state governments did cut their contributions to districts upon the districts’ receipt of ARRA grants, then an interesting, and more complicated, issue is how state governments might have used these freed-up dollars.
References
American Association of School Administrators. “Weathering the Storm: How the Economic Recession Continues to Impact School Districts.” Report of Findings, March 2012. See http://aasa.org/uploadedFiles/Policy_and_Advocacy/files/ Weathering_the_Storm_Mar_2012_FINAL.pdf.
Council of Economic Advisers. “Estimates of Job Creation from the American Recovery and Reinvestment Act of 2009.” Executive Office of the President of the United States. May 2009. See www.whitehouse.gov/administration/eop/cea/Estimate-of-Job-Creation.
Dupor, Bill; and Mehkari, M. Saif. “Schools and Stimulus.” Federal Reserve Bank of St. Louis Working Paper 2015-004A. See http://research.stlouisfed.org/wp/more/2015-004.
Executive Office of the President of the United States. “Educational Impact of the American Recovery and Reinvestment Act.” A report issued by the Domestic Policy Council in cooperation with the U.S. Department of Education, October 2009. See www.whitehouse.gov/assets/documents/DPC_Education_Report.pdf.


