



Of the five regional Federal Reserve surveys released to date, all show manufacturing expanding in August 2014. A complete summary follows. The market expected this survey index at 10 to 14 (consensus 10.0) versus the 20 actual [note that values above zero represent expansion].
Fifth District manufacturing activity expanded in October, according to the most recent survey by the Federal Reserve Bank of Richmond. Shipments and the volume of new orders grew robustly this month, while manufacturing employment growth continued at a moderate pace. Average wages rose modestly and the average workweek shortened slightly compared to a month ago.
Manufacturers remained optimistic about future business conditions. Firms continued to look for faster growth in shipments and in the volume of new orders. Additionally, producers expected increased capacity utilization and anticipated rising backlogs in the six months ahead. Manufacturers looked for little change in vendor lead times.
Survey participants’ outlook for the months ahead included faster growth in the number of employees and average wages, with steady growth in the average workweek. Prices of raw materials and finished goods rose at a slightly faster pace in October. Manufacturers expected slower growth in prices paid and anticipated faster growth in prices received over the next six months.
Current Activity
Overall, manufacturing conditions strengthened in October. The composite index climbed to a reading of 20 following last month’s reading of 14. The index for shipments advanced 12 points, ending at 23. Additionally, the index for new orders moved up eight points to 22. Manufacturing employment grew at a steady pace this month. The October indicator slipped three points to a reading of 14.
Vendor lead time lengthened, moving the index up two points to 12. Capacity utilization grew on pace with a month ago; the index remained at 13. Backlogs rose at a faster pace this month; the October indicator gained three points, ending at 9. Finished goods inventories rose at a slower pace compared to a month ago. The index shed eight points to finish at 15. Additionally, raw materials inventories rose at a slightly slower rate compared to last month. That gauge moved down one point to settle at 19.
Read entire source document from Richmond Fed
Summary of all Federal Reserve Districts Manufacturing:
Richmond Fed (hyperlink to reports):

/images/z richmond_man.PNG
Kansas Fed (hyperlink to reports):

/images/z kansas_man.PNG
Dallas Fed (hyperlink to reports):

/images/z dallas_man.PNG
Philly Fed (hyperlink to reports):

/images/z philly fed1.PNG
New York Fed (hyperlink to reports):

/images/z empire1.PNG
Federal Reserve Industrial Production – Actual Data (hyperlink to report)
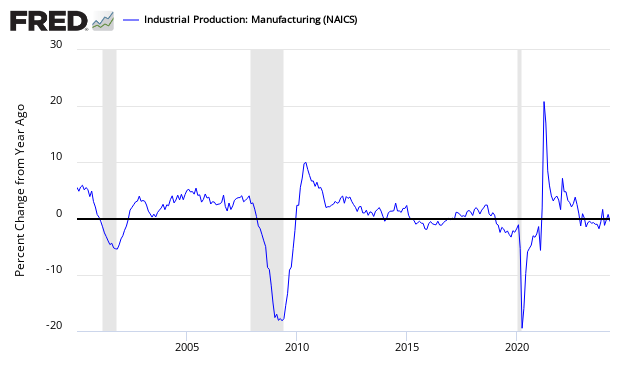
Holding this and other survey’s Econintersect follows accountable for their predictions, the following graph compares the hard data from Industrial Products manufacturing subindex (dark blue bar) and US Census manufacturing shipments (lighter blue bar) to the Richmond Fed Survey (dark green bar).
Comparing Surveys to Hard Data


/images/z survey1.png
In the above graphic, hard data is the long bars, and surveys are the short bars. The arrows on the left side are the key to growth or contraction.


