by Issi Romem, BuildZoom
Whether we recycle or dump our waste into a landfill, we tend to replace that which is old, with something shiny and new. Homes are the exception to the rule. Almost half of the homes in the U.S. were built over 40 years ago, and keeping the housing stock up-to-date is a task of epic proportions.[1]

There are over 130 million homes in the U.S. and the bill for their maintenance and remodeling is on the order of 300 billion dollars a year.[2] Yet despite the staggering figure, existing sources of data on the extent of remodeling activity are of limited use when it comes to examining the trends in different metropolitan areas.
Enter BuildZoom: starting today, the BuildZoom Remodeling Index will track changes over time in permitted residential remodeling and maintenance activity for a growing number of U.S. metro areas. Each month, a new report will be issued covering up-to-date changes at the metro area level.
How? Over the past two years, we have collected information on building permits from hundreds of cities and counties throughout the country, and have built a system that quickly incorporates new information as it becomes available. We currently have information on approximately 45 million permits, and the number is growing quickly. The BuildZoom Remodeling Index uses the data to track changes in the rate at which permits are issued for improvements to existing residential properties. That’s the gist of it – for the nitty-gritty, see the methodology section below.
A taste of things to come
Whereas some types of data – like the data that fuel Zillow and Trulia’s home price indices – have been around for many years and are sold by vendors in clean, ready-to-use form, our data are fresh and genuinely raw. As a result, we have to digest them more thoroughly before they can be analyzed, which takes time. But we don’t want to keep you waiting, so to give you a taste of things to come we have compiled the BuildZoom Remodeling Index for New York, Seattle, Miami and Atlanta. We chose these cities because we are confident in the underlying data, and because New York and Seattle show such a strikingly different pattern than Miami and Atlanta.
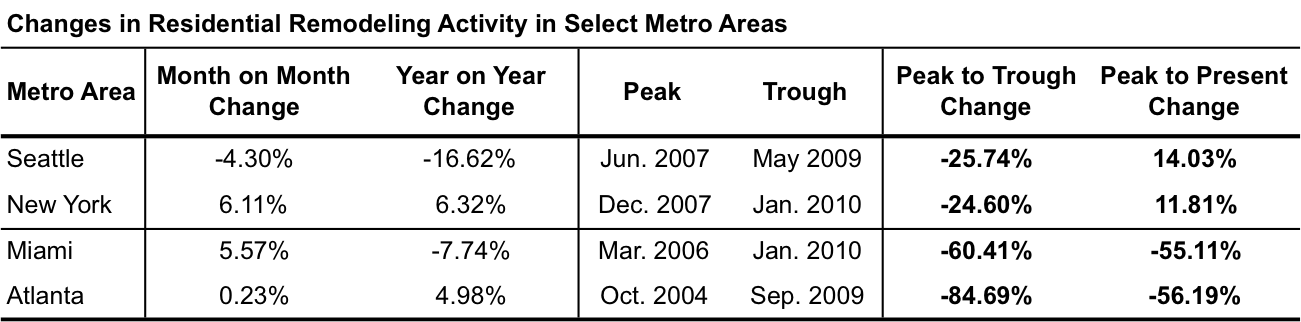
We will expand the coverage of the BuildZoom Remodeling Index gradually each month, adding new metro areas to the mix until we’re able to provide a viable, national index. The indices for the current selection are presented in the two figures below, and some statistics are given in the table that follows.
What can we say right off the bat?
Let’s start with the basics. The four metro areas we selected – as well as many others that we have examined but aren’t sharing yet – all demonstrate a pattern that economists call pro-cyclical, which means that more remodeling takes place when the economy is doing well than when it isn’t. This may seem like a no-brainer, but it is not self-evident.
In difficult times people tend to downgrade from the products they use to more frugal alternatives. Saving money by remodeling a home instead of buying a new one in times of difficulty would match that tendency, but it would make remodeling activity appear counter-cyclical, i.e. remodeling would be more common when the economy is weaker, contrary to what we see. Evidently, remodeling as a frugal alternative to home buying does not appear to be the dominant theme.
So why do we see more remodeling activity when the economy does well? A rigorous answer to the question is beyond the scope of this blog post, but some possibilities present themselves. First, as with other types of consumer spending, people are likelier to remodel when they have more disposable income, which happen when the economy is strong. When the economy is such that people feel secure in their jobs and in their economic prospects, they are also more amenable to taking on debt for remodeling.
Second, a strong economy tends to align with a strong housing market and vice versa – as the last decade has demonstrated. If we frame remodeling as an investment whose payoff depends on home prices, but whose cost does not, it becomes clear that the return on the investment is magnified when the economy does well and home prices are higher. Moreover, elevated home prices mean that yesterday’s homebuyers now have more home equity to tap for remodeling.
Finally, a buoyant economy tends to accelerate the rate of new household formation, which directly feeds into the demand for remodeling.
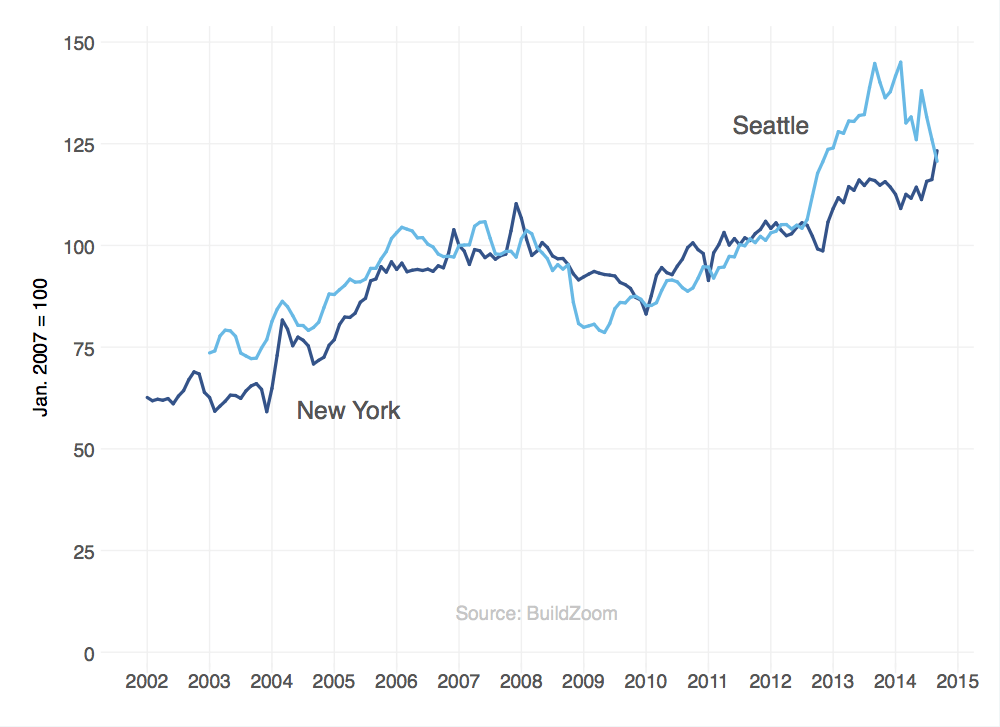
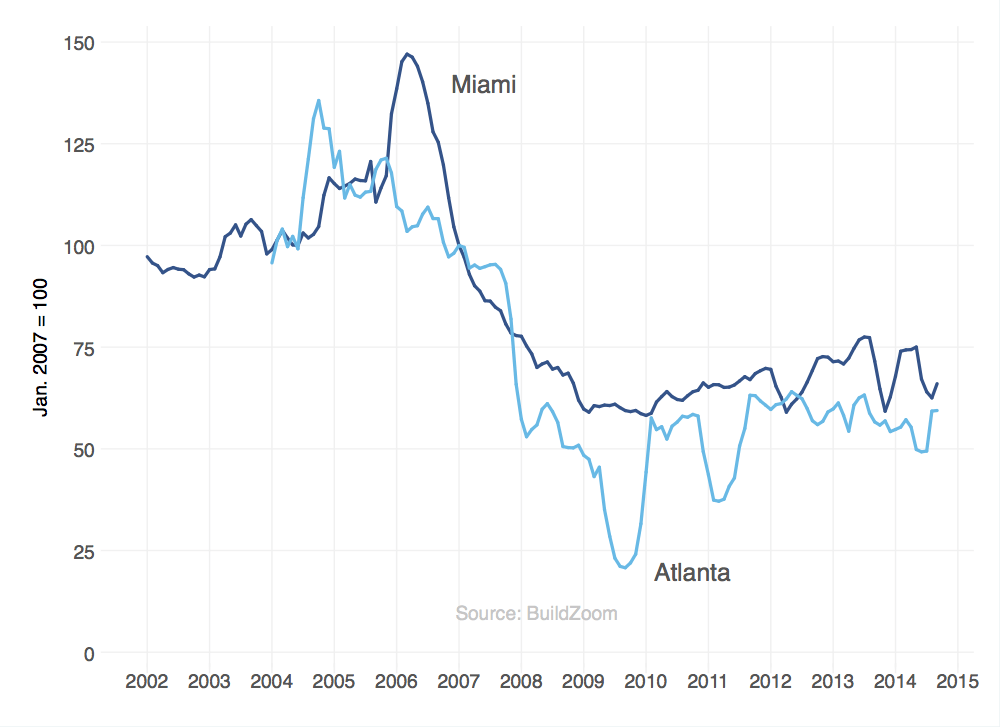
New York and Seattle have recovered to pre-crisis levels; Miami and Atlanta are still well below them
The housing market crisis and its aftermath were much more pronounced in some metro areas than in others, and this shows up in the extent of remodeling activity as well. Whereas the index indicates that remodeling activity in New York and Seattle fell by approximately 25% from its pre-crisis high to its post-crisis low, the corresponding figures for Miami and Atlanta are a 60.4% plunge and an 84.7% nose dive.
Remodeling activity in both New York and Seattle has since recovered and has even surpassed its pre-crisis peak by 11.8% in New York and 14.0% in Seattle. Miami and Atlanta, in contrast, are both currently hovering approximately 55% below their pre-crisis high.
Although the current rate of remodeling in Miami and Atlanta may be too low to maintain the housing stock in good repair over an extended period, we should not necessarily expect – or even want – Miami and Atlanta’s remodeling activity to revert to its highest levels pre-crisis. Both cities’ housing markets were particularly heated in the run-up to the housing market crisis, and the rates of remodeling activity they were experiencing before the crisis may not have been sustainable or even sensible.
To illustrate, suppose remodeling activity were elevated to the point of absurdity such that, on average, homes were re-painted every month and kitchens were gutted and replaced every year. This rate of remodeling is much higher than the rate needed to maintain the housing stock in good repair, and is clearly wasteful. Of course, homes were not painted every month in Miami or Atlanta at any point in time. Rather, the point is that where Miami and Atlanta stand with respect to some notion of a healthy, sustainable rate of remodeling activity is more complicated than just asking how far beneath their pre-crisis peaks they remain.
We may take a stab at the more complicated question in a later blog post, but in the meantime suffice to say that the BuildZoom Remodeling Index is useful in gauging how remodeling activity is changing, but it does not, in and of itself, imply any judgment of the developments.
Methodology
Each month, we estimate the percentage month-on-month (MoM) change in the number of residential remodeling permits issued by each permitting agency.[3][4] We aggregate the MoM changes within each metro area by taking a weighted average across the permitting agencies. The weights are determined by the long-run monthly rate of residential remodel permitting by each permitting agency, so as to reflect that agency’s relative contribution to permitting activity within the metro area.[5] The resulting MoM changes are smoothed using a 3-month moving average and adjusted for seasonality using standard U.S. Census software.6 The metro area index is obtained by integrating the MoM changes back to levels, which are pegged to a value of 100 in January 2007 – roughly the onset of the housing market crisis. Note that the index measures changes in total remodeling activity; it does not measure changes in the average remodeling activity per capita or per housing unit.
Notes:
- According to the 2013 1-year American Community Survey, the median residential structure in the U.S. was built in 1974, implying an age of 37 years at the time.
- Harvard University’s Joint Center for Housing Studies estimates that the annual expenditure on home maintenance and remodeling is on the order of $300 billion. See Figure 1 of Joint Center for Housing Studies, “The U.S. Housing Stock: Ready for Renewal,” January 23, 2013.
- We identify building permits as remodeling permits in two steps. First, we identify building permits strictly involving new construction using a machine-learning algorithm. Second, we associate with new construction any building permits issued within 12 months of a prior permit on the same property, which was classified as strictly new construction. We refer to all remaining permits as remodeling permits.
- Within each metro area, data is only incorporated into the index from a subset of permitting agencies. The set will expand from month to month, which will lead to retrospective revisions of the index.
- All steps described so far are performed in unison by linear regression. Specifically, a separate regression is performed for each metro area in which the monthly counts of remodeling permits for the permitting agencies are regressed on a set of permitting agency fixed effects and a saturated set of time period dummy variables. The metro area time series of MoM changes is the set of coefficients on the time period dummy variables, with the first time period omitted from the regression and its coefficient set to zero.
- X-13 ARIMA-SEATS.


