Econintersect Climate and Weather Update, 8 September 2014 Alternative Version re graphics
Written by Sig Silber

First let’s talk about 6 – 14 day outlook issued today September 8 for the U.S.
I am only showing the “second week” namely the day 8 -14 outlook. The first week can be found in Part II of my report but 8 – 14 days covers most of the 6 – 14 day period.
8 – 14 Day Outlook
Temperature Forecast:

Precipitation Forecast:

Notice that:
Last week I introduced the “Analogs” which NOAA provides related to the 5 day period centered on 3 days ago and the 7 day period centered on 4 days ago. “Analog” means that the weather pattern then resembles the recent weather pattern and was used in some way to predict the 6 – 14 day Outlook.
What if anything are they telling us today.
Analog Centered Day | ENSO Phase | PDO | AMO | Other Comments |
| 1958 Sept 1 | Pre El Nino | + | + | Between two El Nino’s |
| 1980 Aug 31 | Neutral | + | Neutral | |
| 1980 Sept 1 | Neutral | + | Neutral | |
| 1983 Sept 4 | La Nina | + | Neutral | Right after an El Nino |
| 1983 Sept 6 | La Nina | + | Neutral | Right after an El Nino |
| 1992 Sept 8 | Post El Nino | + | – | Right after an El Nino |
| 2000 Sept 9 | La Nina | – | + | A very strong La Nina |
| 2001 Sept 5 | Neutral | – | + | Right after a La Nina |
El Nino Update.
From todays NOAA Report.
Australia will issue an update tomorrow.
And from the CPC/IRI based out of Columbia University issued Sept 4
Notice by April-May-June the probability of Neutral Conditions exceeds the probability of El Nino Conditions. So according to those involved in this analysis it will be a fairly short El Nino.
But what kind of an El Nino will it be? Not all El Ninos are alike and in recent years the distintion between traditional or canonical (true to form) El Ninos and Central Pacific El Nino’s often called El Nino Modoki has become increasingly clear. In Japan they are forecasting an El Nino this winter followed by an El Nino Modoki the subsequent winter. This becomes important because the impacts of each type of El Nino on weather worldwide is very different.
This is illustrated in the following maps:
Traditional El Nino Surface Temperature El Nino Modoki Surface Temperature

Here are some blown up versions of those maps but the quality is low since the originals are small so when you blow them up you lose resolution.
Full El Nino Surface Temperatures

El Nino Modoki Surface Temperatures.

And now considering precipitation
Traditional El Nino Precipitation El Nino Modoki Precipitation

And again here are some blown up verisons
Traditional El Nino Precipitation

El Nino Modoki Precipitation

And looking just at the U.S.
Traditional El Nino Preciptation

El Nino Modoki US Precipitation

Below is a breakdown by area of the World

You can find these graphics and more information here.
So there is a big difference yet BOTH WILL REGISTER AS AN EL NINO ON THE ONI INDEX.
Some think a Modoki is some sort of strange thing. To me it looks like a Modoki is simply an El Nino that did not fully make it to Equador or after reaching Equdor has taken its sweet time getting all the way back to the Western Pacific Warm Pool. From a weather perspective with a Modoki you end up with two Walker Cells. So you have a lot of precipitation in the Central Pacific.
Most believe the El Ninos of 2002/2003 and 2004/2005 were actually of the Modoki variety and you can see that in the data for New Mexico and Rio Grande Stream Flow. The below may be a Bob Tisdale compilation but it is based on the Ashoc formula.

The 2009/2010 El Nino was also a Modoki, So you see what you read in the news may not be very useful. I do not believe that many TV and Radio station weather people understand the difference between these two types of El Nino’s. It is fairly recent knowledge.
To make things even more complicated some believe there are two kinds of El Nino Modoki’s and this is described here.
I am not going to go into the details this evening but based on these authors we have had since 1950 we have had sixteen El Ninos broken down as follows:
| Traditional or Canonical El Nino | Modoki Type I | Modoki Type II |
| 1951/1952 | 1963/1964 | 1968/1969 |
| 1965/1966 | 1987/1988 | 1979/1980 |
| 1972/1973 | 1990/1991 | 1991/1992 |
| 1976/1977 | 2002/2003 | 1992/1993 |
| 1982/1983 | 2004/2005 | |
| 1997/1998 | 2009/2010 | |
Although both the researchers work for NOAA and were based in Miami Florida when they did this research they seem to have used the Chinese System of indentifying an El Nino i.e. forcusing on Nino 3.0 rather than Nino 3.4. Nino 3.0 is the eastern part of Nino 3.4. This may explain the slight difference between their characterizations and that of Bob Tisdale and NOAA in that these Chinese authors do not seem to recognize 2006/2007 as any kind of El Nino. I have to look into that further.
But the general conclusion is that since the PDO turned negative in 1998 we may not have had a traditional or what is called technically a canonical El Nino. I do not have the time right now to match the above categorization of Modoki I and II to precipitation patterns in the U.S. The referenced authors focused on the Western Pacific mainly China.
It tells me that we have to be very careful about how we relate to something called an El Nino since there are at least three varieties and each has a different impact on Global Weather.
A very good reference to the literature on ENSO can be found here. It is an amazing document and the discussion on Global Waming is very interesting. There is no consensus on how Global Warming has or will impact ENSO although many think it does, But they disagree on how.
Back to Oceans
I presented this chart last week.
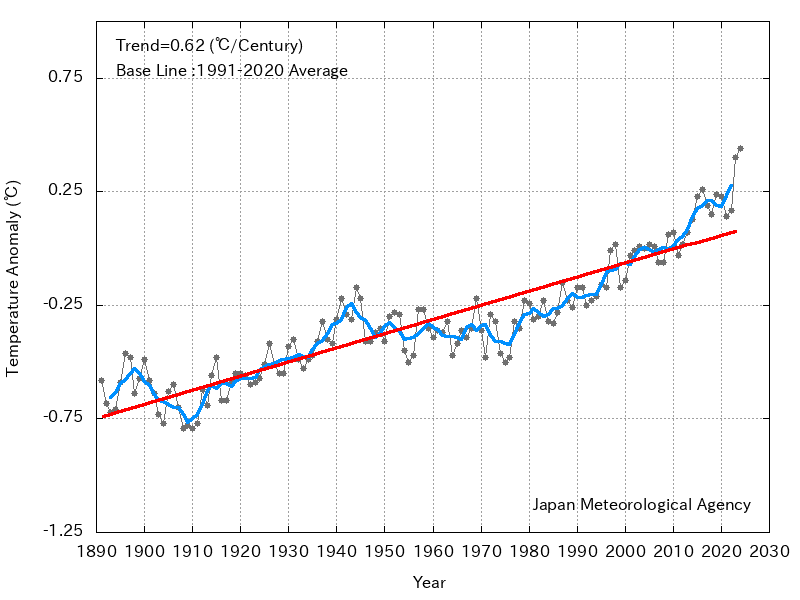
From Japan Met Global Environment and Marine Department Report
“The annual mean annual global average sea surface temperature in 2013 was +0.13°C above the 1981-2010 average, making it the 2nd highest since 1891. The long-term trend of the global average sea surface temperature for 1891-2013 was about 0.51°C per century. Although positive anomalies above the long-term trend have frequently been observed since the late 1990s, the global average sea surface temperature has generally remained at similar levels since the early 2000s.”
Here is another more short-term oriented chart.
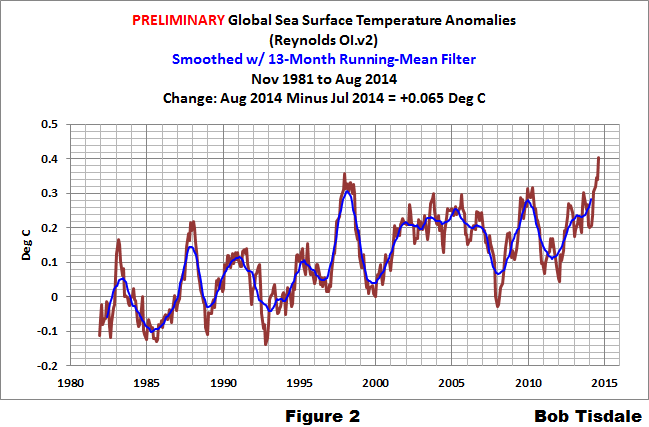
Notice the spike in August. This appears to be due to a rise in the SST of the Northern Pacific. Bob Tisdale attributes this to the anomalous blocking pattern over Alaska and indeed we did have and continue to have colder than climatology temperatures in the Center of North America. So this could be a short-term balancing of heat between land and ocean but I am not so sure. I do not think this is the signature of Global Warming but it may well be related to the changes taking place in the Pacific possibly related to El Nino or the PDO. Not sure I will get into this tonight but there are variations of El Nino Modoki that are consistent with this pattern.
A Few Thoughts on the North American Monsoon
The following map is the mid-atmosphere 7-Day chart rather than the surface highs and lows and weather features. In some cases it provides a clearer and less confusing picture as it shows the major pressure gradients and the 500 MB chart often is a good guide to conditions at the surface.

Notice the “Four Corner’s High”as of today’s forecast i.e. September 8, for a week from now (the graphic is about Day 7) appears to be AWOL. I usually draw a clockwise circle around this High to help imagine how it might impact overall circulation. This may be the last time I show this graphic until next summer as the Southwest Monsoon is about to go on vacation.
Click here for the Econintersect Weather and Climate Page Where You will Find:
- NOAA and other agency graphics (including international agencies) that auto update. So this includes both short term- and seasonal “updates”. It will ALWAYS be up to date even if my commentary on the graphics is not. I update my commentary when it seems necessary and certainly every Monday but some of these graphics auto update every six hours.
- Economic and other Impacts of major weather events. Not sure there is any other place to obtain this information consistently other than very specialized subscription services.
- Information on Climate Cycles both those which are fairly short term i.e. less than a decade in duration and multi-decadal cycles.
- Economic and other Impacts of those Climate Cycles which are referred to by the IPCC as Internal Variability as opposed to secular Climate Change which is always in the same direction. Again I am not sure if there is another source for this information where it is pulled together in one place as I have.
- Information on Anthropogenic Global Warming science i.e. the secular change in our climate that overlays both short term weather and historical climate cycles as well as black swan events like volcanic eruptions. I prefer to call this Global Warming as it is the warming that triggers the other changes.
- Economic and other Impacts of Global Warming. The IPCC AR5 WG2 attempts to describe and quantify these and I have some excerpts from their report. Over time I will go beyond their report.
For now this is all in one article which may be a little difficult to navigate but that will soon change and the information will be accessed easily by topic.


