


by Congressional Budget Office
A CBO blog post yesterday noted that federal spending is projected to rise noticeably relative to the size of the economy over the long term because of growth in spending for Social Security, major health care programs, and interest on the government’s debt. Today we will discuss the factors that account for the projected growth in the first two of those major components of the budget.

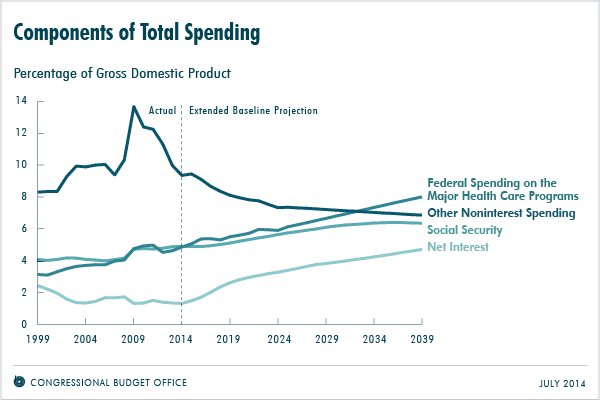
Under current law, spending for Social Security would increase from almost 5 percent of gross domestic product (GDP) in 2014 to more than 6 percent in 2039 and beyond (see the figure below). Even more of the anticipated growth is expected to come from the government’s major health care programs (Medicare, Medicaid, the Children’s Health Insurance Program, and subsidies offered through health insurance exchanges): CBO projects that, under current law, total outlays for those programs, net of Medicare premiums and certain other offsetting receipts, would grow much faster than the overall economy, increasing from just below 5 percent of GDP now to 8 percent in 2039.
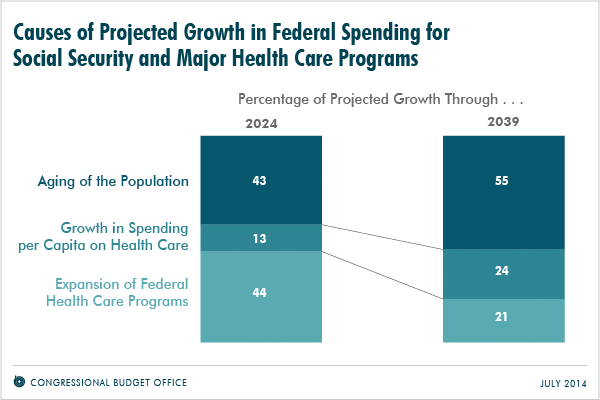
Those projected increases in outlays for Social Security and the major health care programs are attributable primarily to three causes: the aging of the population, rising health care spending per beneficiary, and the Affordable Care Act’s (ACA’s) expansion of federal subsidies for health insurance. Among those three factors, aging is the key driver of spending over the long-term—increasing the share of the population receiving benefits and also affecting the average age (and thus the average health care costs) of beneficiaries; it accounts for 55 percent of the projected growth in federal spending for Social Security and the major health care programs as a share of GDP through 2039 (see the figure below).
The Aging of the Population
The retirement of the baby-boom generation portends a long-lasting shift in the age profile of the U.S. population—a change that will substantially alter the balance between the working-age and retirement-age groups. The number of people age 65 or older will increase by about one-third over the next decade, and by 80 percent between now and 2039 (see the figure below).
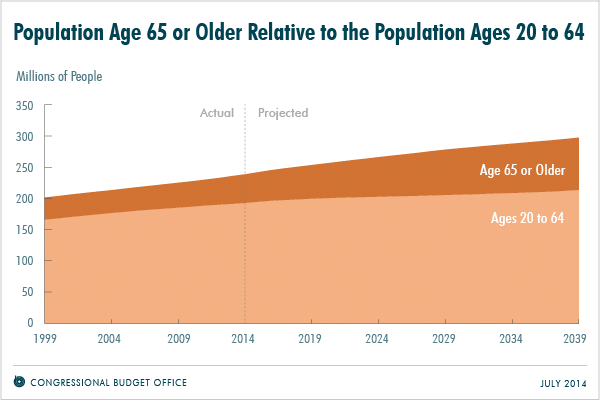
As a share of the total population, the number of people age 65 or older is projected to grow from the current 14 percent to 21 percent in 2039. By contrast, the share of the population between the ages of 20 and 64 is expected to drop from 60 percent to 54 percent. Those trends are expected to continue in later decades, although at a slower pace, as life expectancy increases.
As more members of the baby-boom generation reach retirement age and as longer life spans lead to longer retirements, a significantly larger share of the population will receive benefits from Social Security and Medicare (see the figure below). Aging of the population is the main factor driving the projected growth of Social Security. Under current law, about 77 million people would collect benefits in 2024 and more than 103 million people would in 2039, compared with 58 million who currently receive them. For Medicare, aging will increase the number of people receiving benefits by about one-third over the next decade.

Rising Health Care Spending per Beneficiary
Although the growth of health care spending has been slower during the past several years than it had been historically, CBO projects that spending per enrollee in federal health care programs will continue to increase at a faster pace than per capita GDP over the next 25 years. The growth rate of spending per Medicare beneficiary is projected to remain very low over the next few years—reflecting slow growth in the use of medical care, scheduled cuts to payment rate updates, and an influx of younger beneficiaries—but is then projected to increase gradually through 2039 (although remaining below its average growth rate of the past few decades). Compared with Medicare, costs per enrollee in Medicaid and private insurance are expected to grow more rapidly over the coming decade, but CBO projects a gradual slowing in later years. Although costs per beneficiary in federal health care programs are projected to increase faster than per capita GDP over the 25-year projection period, overall the difference between those two growth rates will be smaller than its average of recent decades, CBO projects. For Medicare, the rate of growth in costs per beneficiary is projected to exceed the rate of growth in per capita GDP by an average of 0.6 percent per year from 2015 through 2029; for Medicaid, that difference is 1.5 percent per year.
Expansion of Federal Subsidies for Health Insurance
Under provisions of the ACA, many people can purchase subsidized insurance through the health insurance exchanges (or marketplaces) that are operated by the federal or state governments. Those subsidies come in two forms: refundable tax credits that can be applied to premiums, and cost-sharing subsidies that reduce deductibles and copayments. CBO anticipates that 19 million people will receive subsidized health insurance coverage through the exchanges (and that several million others will obtain unsubsidized coverage) in each year between 2019 and 2024.
In addition, as a result of the ACA and a subsequent Supreme Court ruling, each state has the option to expand eligibility for Medicaid to most nonelderly adults whose income is below 138 percent of the federal poverty guidelines (commonly known as the federal poverty level). By calendar year 2018, CBO anticipates, about 80 percent of the potential newly eligible population will live in states that will have expanded their programs. Each year between 2018 and 2024, 13 million more people, on net, are projected to have coverage through Medicaid and CHIP than would have had such coverage in the absence of the ACA.
About the Authors
Xiaotong Niu and Julie Topoleski are analysts in CBO’s Health, Retirement, and Long-Term Analysis Division.
Source: http://www.cbo.gov/publication/45543


