
Econintersect Weather and Climate Forecast Update, 14 July 2014
Written by Sig Silber
Last week I asked the question what will follow this El Nino assuming it develops as most believe it will.

Will the Pacific revert to ENSO (El Nino Southern Oscillation) normal conditions, or La Nina or perhaps something a bit more interesting?
Last week I presented the below forecast from Japan . Notice this is a two-year forecast unlike the one-year forecasts available from most meteorology bureaus. The comments that accompany the model results are especially interesting and this really caught my attention:
Japan long term ENSO forecast
“June 18, 2014
ENSO forecast: The developing El Niño is expected to reach its height in late boreal summer and then continue at least through the winter. After the late winter, it will evolve into an El Niño Modoki.”
 .
.
What is an El Nino Modoki? The below represents the sea surface anomalies during an El Nino Modoki and the main thing to notice is that the surface warming pretty much takes place only in what is called the Nino 3.4 Region of the Equatorial Pacific with colder water to the east and west.

So is this really something unusual or simply the return of the warm water associated with an El Nino on its way back to the Western Pacific? Is it simply a transition phase but one that records as an El Niino because this portion of the Pacific is where the ONI index is calculated which quite often is the index that officially defines an El Nino?
As it turns out, there are two versions of Modoki.

Compare the above to the usual schematics of an El Nino and La Nina shown below.

Notice that with the two versions of Modoki, the Thermocline which is the boundary between the warm surface water and the deeper water is fairly uniform across the Pacific. With the typical El Nino, the Thermocline is pushed down along the coast of South America and for La Nina, the Thermocline is close to the surface along the coast of Peru and Ecuador. Also notice the convection in the Eastern Tropics with the La Nina Modoki which does not take place with a traditional La Nina. Remember these are schematics and every typical El Nino or La Nina and every Modoki is unique.
This is what the Japanese Department of Meteorology JAMSTEC has to say about Modoki.
“El Nino Modoki has recently been identified as a coupled ocean-atmosphere phenomenon in the tropical Pacific Ocean and has been shown to be quite different from the canonical El Nino/Southern Oscillation (ENSO) in terms of its spatial and temporal characteristics as well as its teleconnection patterns (Ashok et al. 2007; Weng et al. 2007; Ashok and Yamagata 2009). Traditionally the term “El Nino” was used for the canonical El Nino associated with warming in the eastern tropical Pacific. However, as we realize now, during El Nino Modoki the sea surface temperature (SST) anomaly in eastern Pacific is not affected, but a warm anomaly arises in the central Pacific flanked by cold anomalies on both sides of the basin (Fig. 1). Together with its counterpart La Nina Modoki, when colder central Pacific is flanked by warmer eastern and western Pacific, the new phenomenon is now called as the ENSO Modoki that assumes both warm and cold phases of its behavior. Several studies have shown that the ENSO Modoki has become more prominent in recent times, as compared to ENSO, and thereby changing the teleconnection pattern arising from the tropical Pacific. Moreover, the associated decadal changes in the sea level are shown to affect not only the islands of central Pacific but remote regions off California and southwestern Indian Ocean (Behera and Yamagata 2009)Figure 1: Schematic diagrams of El Nino Modoki and La Nina Modoki the two phases of ENSO Modoki.
The ENSO Modoki has distinct teleconnections and affect many parts of the world. For example, the West Coast of United States of America is wet during El Nino but dry during El Nino Modoki (e.g. Weng et al. 2008). Recent studies show that teleconnections associated with ENSO Modoki influence the rainfall over India and South Africa (Ratnam et al. 2010; Ratnam et al. 2011).”
Perhaps the most authoritative analysis of the Modoki phenomena was written by Karumuri Ashok et al (2007) and it can be found here. Another useful paper related to the impact of El Nino Modoki on Australia can be found here. Notice that NCAR based in Boulder Colorado has been involved in this research. Thus one begins to wonder if we have a “WeatherGate” situation here when everyone but NOAA is on board.
This information about variations in ENSO beyond a typical El Nino, and a typical La Nina and a typical Neutral condition become important because of the following table that Bob Tisdale compiled:

His full discussion can be found here.
Then we have this list of El Nino events issued by NOAA:

So we have NOAA saying that we had an El Nino in 2002/2003 and 2004/2005 and others saying no that was not an El Nino but an El Nino Modoki. An El Nino should have meant a wet winter for the Southwest whereas a El Nino Modaki should have meant a dry winter. I don’t understand it well enough but there is a seasonal difference in how each pattern impacts precipitation and right now I am just talking about the U.S. Southwest. The full Ashok et al paper to which I provided a link discusses the impacts Worldwide.
To test the claim that 2002/2003 and 2004/2005 were El Nino Modoki’s not typical El Nino’s it occurred to me to look at stream-flow in the Southwest. I apologize for just focusing on the State where I live but this is where I have the easiest access to data and this is where El Nino has a dramatic impact on our precipitation (and temperature).

A larger version can be found by clicking here.
This is a table of releases from not water flowing into Elephant Butte/Caballo Reservoir (the major reservoir for storage of water in New Mexico) but in low-release years the low releases pretty much tells you that the inflows were low. Since 2003, the situation on the Rio Grande has been very bad but that is not unexpected due to both the Pacific as measured by the PDO and the North Atlantic as measured by the AMO being in the PDO-/AMO+ high-drought condition. But even in that condition, there should be some relief from El Nino years although (and I documented that a couple of months ago in this column) when the PDO is in its negative cold phase, the ratio of El Nino years to La Nina years is 1:2 i.e. La Nina years are twice as frequent.
But never-the-less, NOAA (really their NCEP division) reported an El Nino in the 2002/3, 2004/5 and 2006/7 winters meaning that stream-flow during the winter i.e. the second year in the above description of each El Nino should have been relatively wet compared to other years in that decade. But 2003 which was reported by NOAA as being an El Nino year (and a moderately strong one at that) was certainly not a wet year even though it had been declared an El Nino year. 2005 and 2007 were not too bad but not much different than non-El Nino years.
So the question is were they indeed El Nino years or were 2002/2003 and 2004/2005 really El Nino Modoki years? To attempt to answer this question, I took a look at the two most used indices. NOAA relies primarily on the ONI index but some other scientists think the MEI index is better. The Oceanic Niño Index (ONI) Index can be found here. The Mutivariate ENSO Index (MEI) can be found here. Some believe it is a better Index in that it covers more variables than the ONI Index.
I would have preferred to provide the full table of data in this part of my report. But the last time I tried to do that it was a horrendous task because you have twelve values per line and there are numbers to three decimal points and you can count how many characters there are on this line and if I reduce the type size you will not be able to read it. So I provided the links above and will tell you what I found when I looked at the indices which you can do yourself via the links provided.
All three declared El Ninos met the criteria of both the ONI and WEI indices. And yet Bob Tisdale has declared the 2002/2003 and 2003/2005 to really have been El Nino Modoki’s which would be dry for this area and indeed 2003 was a very dry year.
So my little exercise of meteorological forensics exercise was inconclusive which is not surprising since for both a typical El Nino and an El Nino Modoki the area of the Pacific described as Nino 3.4 would have above normal surface temperatures and that is what is measured by the ONI index and is part of what is measured by the MEI Index. So at this point I don’t have a conclusive answer but it looks like the 200/2003 so called El Nino may well have been an El Nino Modoki and reading the Ashok et al paper it is pretty clear that in Japan they thought the 2004/2005 so called in the U.S. an El Nino was indeed an El Nino Modoki.
So now I really have become interested in what the winter of 2015/2016 will be like if the Meteorologists in Japan are correct that this predicted El Nino will be followed by an El Nino Modoki. It also suggests to me that water planners need to be a bit more inquisitive about what kind of El Nino or La Nina is being forecast. I am not sure what the situation is around the world but I know what the situation is in New Mexico and here those who manage our water probably think a Modoki is something you might find on a menu at a Japanese restaurant rather than something that might impact their management of water resources.
Now let us take a look at the latest NOAA (NWS.NCEP) ENSO forecast relative to this year’s predicted (but to some extent vanisihing) El Nino.
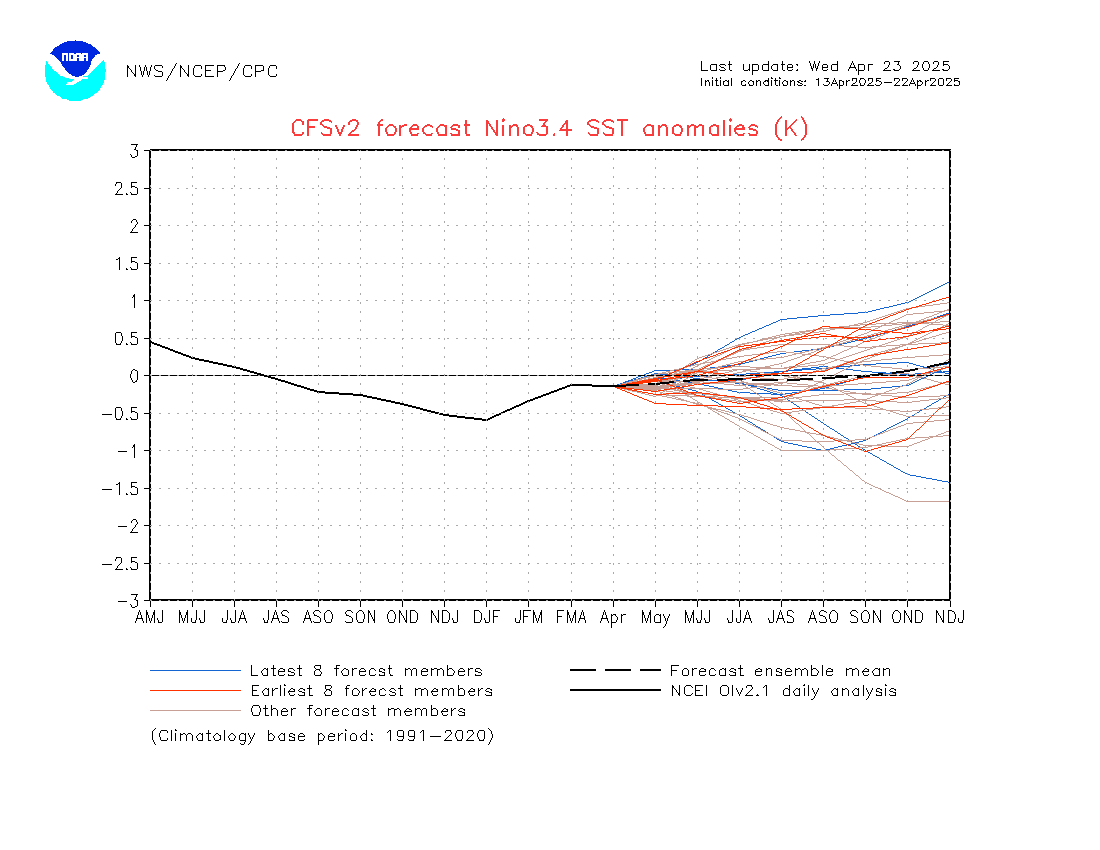
It is still showing the same pattern of a relatively short, moderate-strength El Nino which will definitely impact the coming winter in the U.S.
Below is a broader view looking out to Jan 2015 through March 2015 which looks at sea surface temperatures (SST) everywhere not just one area i.e. Nino 3.4 which is where the ONI Index shown in the earlier graphic is measured.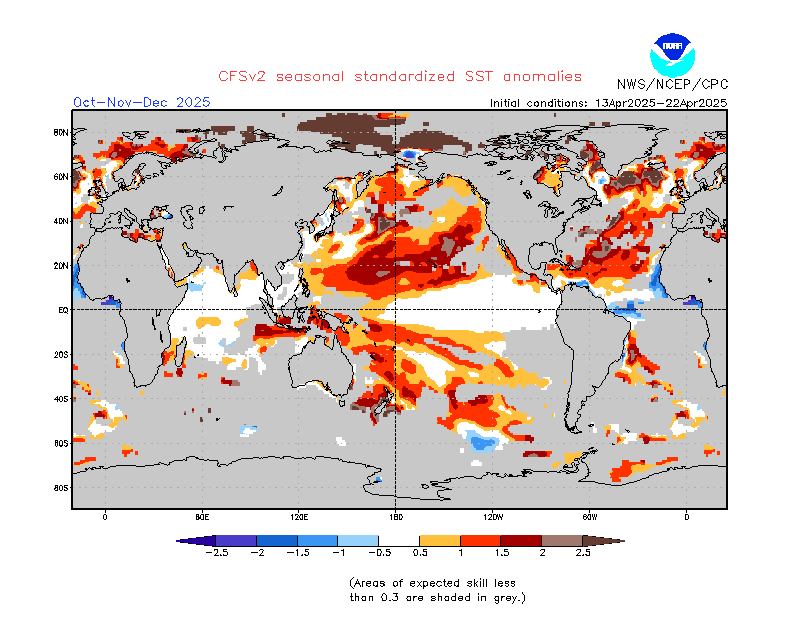
You can see the warm water off the coast of South America but it still does not look like a typical strong El Nino pattern. I will go into it next week but it tends to look lest robust with each new edition of the above graphic. There are lags between sea surface temperatures and precipitation impacts but it looks to me like the Fall might show more El Nino impacts than Spring.
The overall ocean situation right now is PDO+/AMO+ which is condition C in the ocean cycle maps shown if you click below and look for the McCabe et al maps. If the PDO has indeed flipped (which I doubt) that could as they say change everything. Thus it seems to me that it may be a year before we know if we have moved from PDO-/AMO+ to some other combination that includes a warm Pacific Ocean. If that is the case we are talking about major changes in our climate worldwide and probably a resumption of more rapid outward signs of Global Warming. That would be of enormous significance.
There have been large changes in the short-term weather outlook and I discuss these with the graphics that are available on what I call my “permanent page” which you will get to if you click below. It is called “permanent” in that I maintain a lot of information there that remains the same categories of information from week to week but the graphics themselves auto-update (i.e. change) on the schedule that these graphics are updated by the issuing agency. I do my best to update my commentary of those graphics. The main article that gets released each week, such as this article, tends to be thematic and address either an important theme or a something that is in the news. It is a weather and climate news column with a focus on the economic impacts of weather and climate.
Click here for the latest data from NOAA (National Oceanic and Atmospheric Administration) and other sources on the Econintersect Weather and Climate page.


