Econintersect Weather and Climate Forecast Update, 16 June 2014
Written by Sig Silber
The chances of an El Nino for next winter are reported as continuing to increase. Let’s examine the evidence to see if that claim withstands scrutiny.

Or is this yet another false alarm as took place two summers ago? And what about the North American Monsoon (NAM)? Will it be early or late and strong or weak?
First let us talk about the North American Monsoon (NAM). Here is what we are looking for in June as a precursor to the development of the North American Monsoon. A nice big high pressure center in Northern Mexico heating up the land.

Here is what NOAA has forecast for seven days from now i.e. about three-quarters through June.

Is it a match? I don’t see it. Although it looks better today than it did on Thursday when I started to write this article. The NAM might be just a tad slow to develop this year. I also do not see the heat over the Rocky Mountains or the warming of the Gulf of Mexico although it is no longer anomalously cold. The PDO (Pacific Decadel Oscillation) index remains positive and very positive. However the AMO (Atlantic Multidecadal Oscillation) index has gone back to positive albeit a very low index reading that is hardly conclusive; but we can no longer say the AMO is negative.
With regards to the start date of the NAM especially in terms of Arizona, this article might be of interest. People used to focus on the dew point (54F being the supposed trigger for the Monsoon in Tucson and 55F for Phoenix) but the above linked article seems to place more weight on the water temperature of the Gulf of California (86F). So that is something to watch.
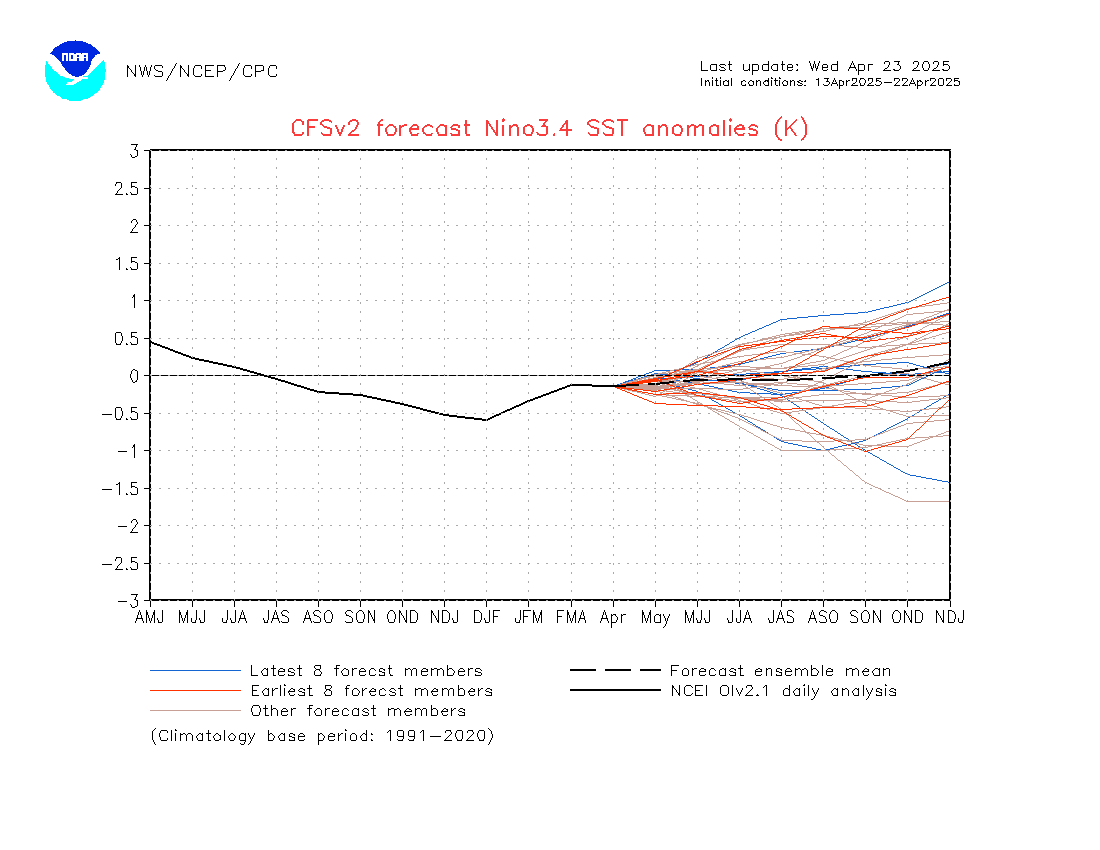
And what about El Nino? This graph basically is the plot of the forecasts of many models of the ONI (Oceanic Nino Index) with the mean shown. It still looks fairly promising.
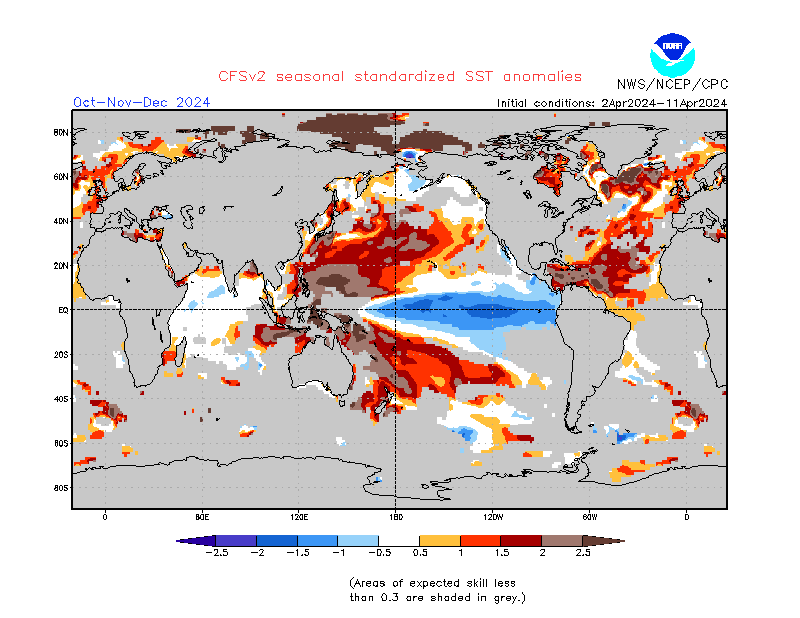
This is a broader view as it looks at sea surface temperatures (SST) everywhere not just one area i.e. Nino 3.4 which is where the ONI Index is measured.
Below is what that graphic looked like two weeks ago. BTW you can see the currency of the forecast by the date of the initial conditions used to run the computer model which is shown above the maps on the right.
Below is the current forecast: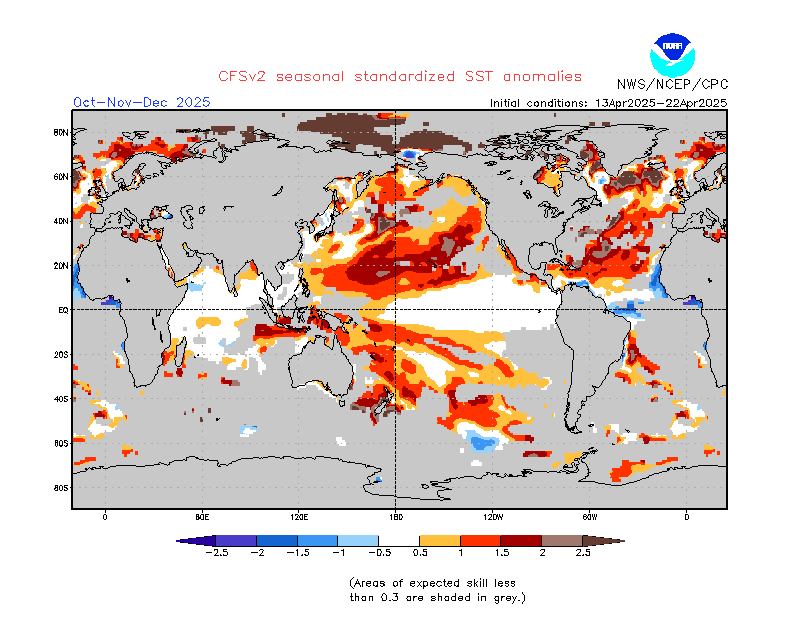
Notice the far less projected amount of warm water off the coast of Ecuador and Peru which is the signature of an El Nino. So this is a big change in the forecast in a short two-week period.
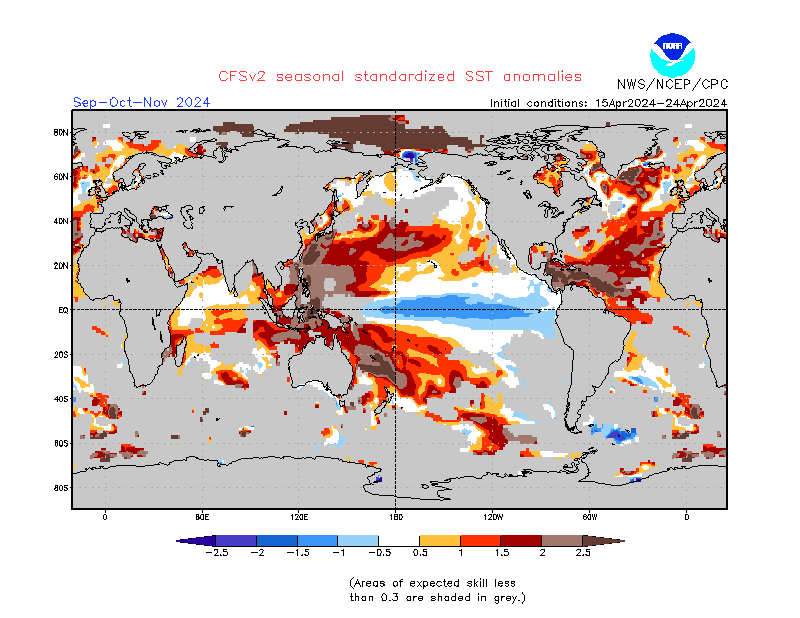
To me the updated forecast for Dec 2014/ Jan – Feb 2015 is not very different from the updated forecast for Nov/Dec 2014/Jan 2015 which is shown below i.e. the models are not currently showing intensification of the El Nino as winter progresses and you can see the same thing on the spaghetti plot for Nino 3.4 conditions above which is a consolidation of multiple model forecasts on one graphic. The Nino 3.4 gets up to about 1.0 and just stays there which is lower than in some prior forecasts.
Now, recognizing that I am showing you forecasts that are six and seven months out and thus inherently unreliable, nevertheless, I feel it appropriate to express caution about the prospects for El Nino into and through the winter of 2014/2015 and the strength and early onset of the NAM.
Click here for the latest data from NOAA (National Oceanic and Atmospheric Administration) and other sources on the Econintersect Weather and Climate page.


