Written by Sig Silber
The chances of an El Nino for next winter continue to increase. We need to begin to plan for this and understand how it may impact the economy.

First let’s talk about the Changes for El Nino this coming winter.
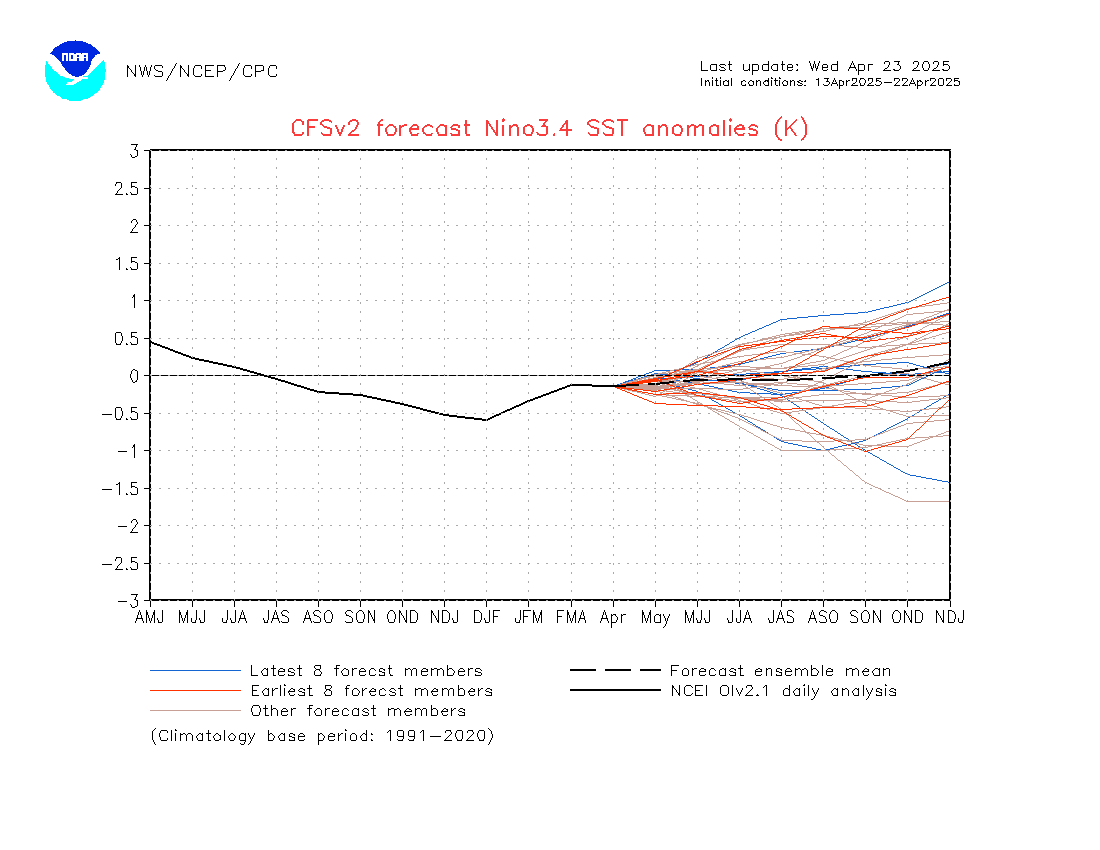
This shows the various model runs last Friday.

The above is an unadjusted forecast but clearly more suggestive of an El Nino coming than the forecast last week. Also notice that none of the newer forecast members (in red) show below the neutral line ENSO (El Nino – Southern Oscillation) conditions.
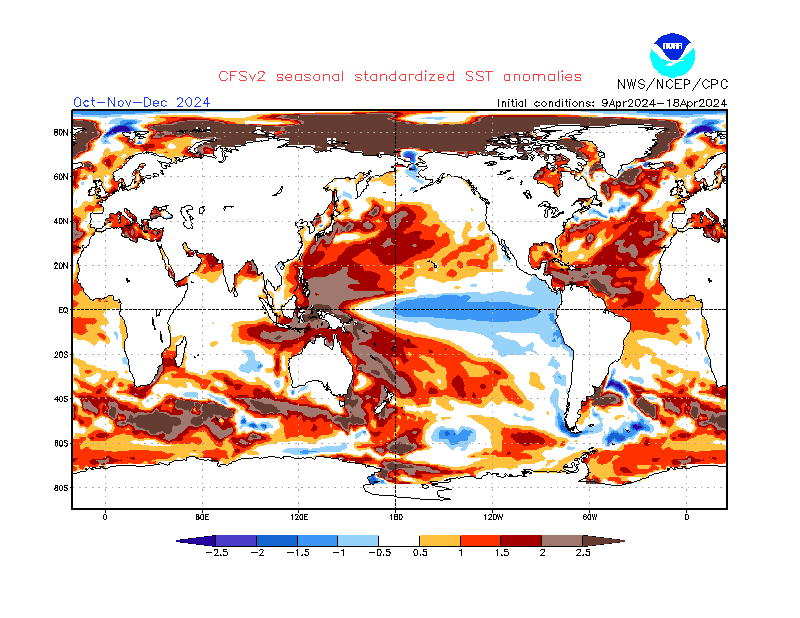
Another useful tool is the overall sea surface temperature of the world which has been statistically adjusted via screens:

It is a little hard to find but the red area off of Ecuador is the signature of El Nino and this is a forecast map for Sept – Nov of this year i.e. the beginning of winter. The red and orange to the west of Ecuador is the Pacific warm pool and you can track how the forecasts are showing where it will be. The more it shifts to the West, the more conditions are of a La Nina nature. The more to the East, the more conditions will be of an El Nino nature.
One can think of this like a giant bath tub. The warm water sloshes back and forth across the Pacific and this has a major impact on the Climate of much of the World. A normal cycle is 5 to 9 years. Further north in the Pacific this distribution of the temperature of the water determines the phase of the Pacific Decadal Oscillation which currently is in its cool phase which you can see by the blue area which appears to be shrinking slightly – hmmm.
How is El Nino likely to impact the U.S.? This first map shows the impact on temperature as compared to ENSO Neutral Conditions.

It would be colder in the south and warmer in the north but it is not a big difference. But is it enough to put the Florida citrus crop in danger? How might natural gas prices be impacted?
This map shows the impact on precipitation.

It is wetter in the West and drier in the Southeast.
And again these are not big differences but when you compare the El Nino data not to the mean but to La Nina conditions, it starts to be more significant.
We must keep in mind the reality that our climate is controlled substantially by longer (lower frequency) ocean cycles one in the Pacific and another in the North Atlantic. So the above graphic reflects average conditions and currently we are in something that is anything but average.
Now for the short-term (6 – 10 and 8 to 14 day forecasts)
Notice that this is a forecast for March 30 through April 7 not the next five days.
First the Temperature forecast for days 6 – 10:

And now the Precipitation forecast for days 6 – 10:

And now what they call Week Two which is days 8 – 14. Notice the overlap of days 8, 9, and 10. This reflects the difficulty of precisely timing the movement of highs (ridges) and lows (troughs) which is the primary mechanism for the development of these forecasts especially during the winter when these patterns tend to move from west to east.
Here is the Temperature forecast:

And here is the Precipitation forecast for the “second week”:

In theory the week one each week should be what was forecast as week two the prior week. This time it has not worked out exactly that way as we still seem to be in a winter pattern. You can track the ability of NOAA to predict things by looking at the prior weeks forecast.
Here are excerpts from what NOAA says about this short-term forecast.
“PROGNOSTIC DISCUSSION FOR 6 TO 10 AND 8 TO 14 DAY OUTLOOKS NWS CLIMATE PREDICTION CENTER COLLEGE PARK, MD 300 PM EDT MON MARCH 24 2014 6-10 DAY OUTLOOK FOR MAR 30 – APR 03, 2014 THERE ARE ENHANCED PROBABILITIES FOR ABOVE-NORMAL TEMPERATURES IN THE SOUTHERN HALVES OF CALIFORNIA, THE INTERMOUNTAIN REGION,
AND THE SOUTHERN ROCKIES, CONTINUING EASTWARD ACROSS CENTRAL AND SOUTHERN PORTIONS OF BOTH THE GREAT PLAINS AND MISSISSIPPI VALLEY, THE OHIO AND TENNESSEE VALLEYS, THE CENTRAL AND SOUTHERN APPALACHIANS, AND THE ATLANTIC COAST STATES FROM SOUTH CAROLINA TO NEW JERSEY. ABOVE-NORMAL TEMPERATURES ARE ALSO FAVORED OVER MUCH OF WESTERN AND NORTHERN ALASKA. BOTH REGIONS OF FAVORED ABOVE-NORMAL TEMPERATURES ARE ASSOCIATED WITH RIDGES.THERE ARE ENHANCED PROBABILITIES FOR BELOW-NORMAL TEMPERATURES ACROSS THE INTERIOR NORTHWEST, MUCH OF EASTERN AND SOUTHERN ALASKA, THE NORTHERN TIER OF STATES FROM EASTERN MONTANA TO MAINE, AND NORTHERN AND CENTRAL FLORIDA, IN ASSOCIATION WITH TROUGHS AND/OR RELATIVELY MODEST PREDICTED HEIGHT ANOMALIES. PROBABILITIES FOR ABOVE-MEDIAN PRECIPITATION ARE ELEVATED OVER THE WEST COAST STATES, THE NORTHERN AND CENTRAL INTERMOUNTAIN REGION, THE NORTHERN HALF OF THE ROCKIES, THE NORTHERN PLAINS, THE UPPER MISSISSIPPI VALLEY, AND FROM THE GREAT LAKES REGION AND OHIO VALLEY EASTWARD TO THE ATLANTIC COAST FROM VIRGINIA TO MAINE, AND ALSO OVER EXTREME SOUTHWESTERN ALASKA.
THESE AREAS ARE EXPECTED TO LIE NEAR THE MEAN POSITION OF THE POLAR JET STREAM AND AHEAD OF THE ANTICIPATED WEST COAST TROUGH. ELOW-MEDIAN PRECIPITATION IS FAVORED OVER MOST OF THE REMAINDER OF ALASKA, MUCH OF ARIZONA, THE SOUTHERN ROCKIES, CENTRAL AND SOUTHERN PORTIONS OF BOTH THE PLAINS AND MISSISSIPPI VALLEY, AND ALONG THE EAST GULF COAST REGION, INCLUDING SOUTHERN SECTIONS OF ALABAMA AND GEORGIA. THESE REGIONS OF EXPECTED BELOW-MEDIAN PRECIPITATION ARE ATTRIBUTED
TO 500-HPA RIDGES AND ABOVE-NORMAL HEIGHTS.”FORECAST CONFIDENCE FOR THE 6-10 DAY PERIOD: NEAR AVERAGE, 3 OUT OF 5, DUE TO FAIR AGREEMENT AMONG THE MODELS AND TOOLS. 8-14 DAY OUTLOOK FOR APR 01 – 07 2014 BELOW-NORMAL TEMPERATURES ARE FAVORED OVER THE NORTHERN CONUS FROM MONTANA AND THE DAKOTAS EASTWARD TO THE NORTHERN ATLANTIC COAST, AND OVER SOUTHEASTERN ALASKA AND THE ADJACENT PANHANDLE REGION. THIS IS ASSOCIATED WITH 500-HPA TROUGHS AND NEAR- TO SLIGHTLY BELOW-NORMAL HEIGHTS. ABOVE-NORMAL TEMPERATURES ARE FAVORED OVER MOST OF THE SOUTHWESTERN QUARTER OF THE CONUS, FAR SOUTHERN FLORIDA, AND FAR WESTERN ALASKA. THIS IS ASSOCIATED WITH SOME OR ALL OF THE FOLLOWING FACTORS… 500-HPA HEIGHTS THAT ARE EXPECTED TO BE CLOSE TO NORMAL, SLIGHT RIDGING, IN ADVANCE OF A TROUGH, AND THE INFLUX OF RELATIVELY MILD PACIFIC AIR. THERE ARE ELEVATED ODDS OF ABOVE-MEDIAN PRECIPITATION ACROSS MOST OF THE NORTHERN AND CENTRAL THIRDS OF THE CONUS, AND THE ALEUTIANS, MOSTLY DUE TO PROXIMITY TO THE MEAN STORM TRACK AND POLAR JET. ODDS OF BELOW-MEDIAN PRECIPITATION ARE ENHANCED OVER PORTIONS OF THE SOUTHERN THIRD OF THE CONUS, AND THE NORTHERN HALF OF ALASKA, RELATED TO MODEST MID-TROPOSPHERIC RIDGING AND/OR MODEST HEIGHT ANOMALIES, AS WELL AS SIGNIFICANT DISTANCE FROM THE MEAN STORM TRACK AND POLAR JET.
FORECAST CONFIDENCE FOR THE 8-14 DAY PERIOD IS: BELOW AVERAGE, 2 OUT OF 5, DUE TO ONLY FAIR AGREEMENT BETWEEN THE MODELS, AND A LOT OF UNCERTAINTY EXPRESSED BETWEEN THE VARIOUS SURFACE TOOLS.


