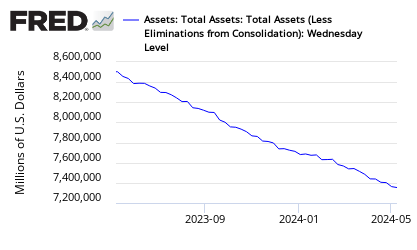
Econintersect: Since 2008 the U.S. Federal Reserve has expanded its balance sheet by nearly $3 trillion. The stated objective is to support the economy and bring down unemployment. The balance sheet status is covered on a regular basis by GEI News. The graph below is from the latest report dated 13 December 2013, showing the balance sheet growth over the past 12 months.
Total Fed Balance Sheet
What has happened in the U.S. as the Fed’s LSAP (large scale asset purchases), commonly known as QE (quantitative easing) have been undertaken over the past five years? Two sources have provided two different examples.
Five Years on Main Street
The 5 Min. Forecast has a graph that tells one story.

Five Years on Wall Street
Fox Business sources (Charles Brady and Elizabeth MacDonald) have presented the following graph (dated 04 March 2013).

Conclusions?
The two graphs above make no positive proofs. But they do support two negative statements.
- QE has not stopped the decline in median household income.
- QE coincides with a massive stock rally so it has not supressed stock prices.
Because there are no counterfactual situations to compare (how would stocks and household incomes have fared without QE) no cause and effect can be proven. But it is clear that one street has had a great five years and another street has not.
Sources:
- Fed’s Balance Sheet 11 December 2013: Record Growth Jumped (GEI News, 13 December 2013)
- Bubble Bursting in Progress (Dave Gonigam, 5 Min. Forecast, 13 December 2013)
- Proof the Fed is Juicing the Markets (Elizabeth MacDonald, Fox Business, 04 March 2013)


