



Two of three regional surveys released to date show manufacturing expanding in July 2013.
Manufacturing activity in the central Atlantic region declined in July, according to the most recent survey by the Federal Reserve Bank of Richmond.* Shipments, new orders, backlogs, and capacity utilization fell this month. Vendor lead-time remained virtually unchanged, while finished goods inventories rose more quickly. On the employment front, hiring and the average workweek flattened. Average wages rose more slowly than in June.
Looking ahead six months, manufacturers were optimistic about business. Expectations were for stronger new orders and shipments, along with a rise in capacity utilization. However, hiring expectations were muted and expected changes in the average workweek remained moderate. In contrast, producers looked for stronger wage growth and they also expected to increase capital expenditures in the months ahead.
Raw materials and finished goods prices grew more quickly in July, according to survey respondents. Looking ahead, survey participants anticipated somewhat faster price growth for both raw materials and finished goods. Compared to their June outlook, however, expectations for growth in prices paid were little changed, while this month’s outlook for the pace of growth in prices received slipped below June’s expectations.
*Seasonal adjustment factors were recalculated this month and applied to historical data to better reflect current economic trends. In this report, comparisons to last month’s indexes are made to the revised June indexes. New factors will be calculated annually.
Current Activity
The seasonally adjusted composite index of manufacturing activity—our broadest measure of manufacturing—fell eighteen points in July to a reading of −11. Among the components of that index, shipments dropped twenty-six points to −15 in July. The new orders index also fell to −15; the previous reading was 9; and the gauge for the number of employees remained at 0 for a second month in July.
Capacity utilization declined this month, with that index falling ten points to −9, and the index for backlogs of orders also fell sharply, ending the survey period at −24 compared to last month’s reading of −1. Finished goods built up more quickly; the index climbed to 15 in July from 5. Raw materials inventories rose again, with that index one point above June’s marker at 11.
Read entire source document from Richmond Fed
Summary of all Federal Reserve Districts Manufacturing:
Richmond Fed (hyperlink to reports):
/images/z richmond_man.PNG
Kansas Fed (hyperlink to reports):

/images/z kansas_man.PNG
Dallas Fed (hyperlink to reports):

/images/z dallas_man.PNG
Philly Fed (hyperlink to reports):

/images/z philly fed1.PNG
New York Fed (hyperlink to reports):

/images/z empire1.PNG
Federal Reserve Industrial Production – Actual Data (hyperlink to report)
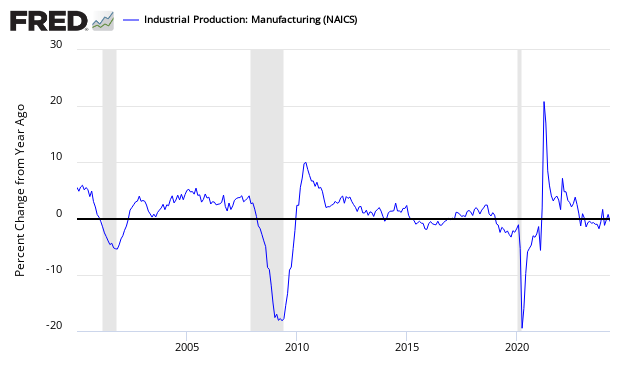
Holding this and other survey’s Econintersect follows accountable for their predictions, the following graph compares the hard data from Industrial Products manufacturing subindex (dark blue bar) and US Census manufacturing shipments (lighter blue bar) to the Richmond Fed Survey (dark green bar).
Comparing Surveys to Hard Data


/images/z survey1.png
In the above graphic, hard data is the long bars, and surveys are the short bars. The arrows on the left side are the key to growth or contraction.


