



This is the second manufacturing survey in April which shows contraction. Please see below.
TENTH DISTRICT MANUFACTURING SURVEY FELL AT A SLOWER RATE
The Federal Reserve Bank of Kansas City released the April Manufacturing Survey today. According to Chad Wilkerson, vice president and economist at the Federal Reserve Bank of Kansas City, the survey revealed that Tenth District manufacturing activity fell by a similar modest amount as last month, and producers’ expectations moderated but remained positive overall.
“We saw another small decline in regional factory activity this month,” said Wilkerson. “Some firms see signs of a pickup in activity later this year driven by pent up demand and new product offerings, but others have become more pessimistic recently as anticipated demand has failed to materialize.”
Tenth District manufacturing activity continued to fall modestly, at a pace similar to last month, and producers’ expectations moderated while still remaining positive overall. Of the firms that reported optimism on future activity, several cited new product opportunities and pent up demand as key reasons for a more positive outlook. However, other firms noted their outlook has deteriorated since the beginning of the year. Most price indexes decreased somewhat or were relatively unchanged from the previous month.
The month-over-month composite index was -5 in April, equal to -5 in March but up from -10 in February (Tables 1 & 2, Chart). The composite index is an average of the production, new orders, employment, supplier delivery time, and raw materials inventory indexes. Durable goods-producing plants reported a smaller decline in activity, but production at nondurable-goods plants fell after increasing last month, particularly for food and plastics products. Most other month-over-month indexes improved somewhat. The production index edged higher from -1 to 1, and the shipments index also increased, with both indexes moving into positive territory for the first time in 8 months. The employment index rebounded from -15 to -3, and the order backlog index also rose. The new orders and new orders for exports indexes were basically unchanged. Both inventory indexes fell further into negative territory after increasing last month.
Summary of all Federal Reserve Districts Manufacturing:
Richmond Fed (hyperlink to reports):

/images/z richmond_man.PNG
Kansas Fed (hyperlink to reports):
/images/z kansas_man.PNG
Dallas Fed (hyperlink to reports):

/images/z dallas_man.PNG
Philly Fed (hyperlink to reports):

/images/z philly fed1.PNG
New York Fed (hyperlink to reports):

/images/z empire1.PNG
Federal Reserve Industrial Production – Actual Data (hyperlink to report)
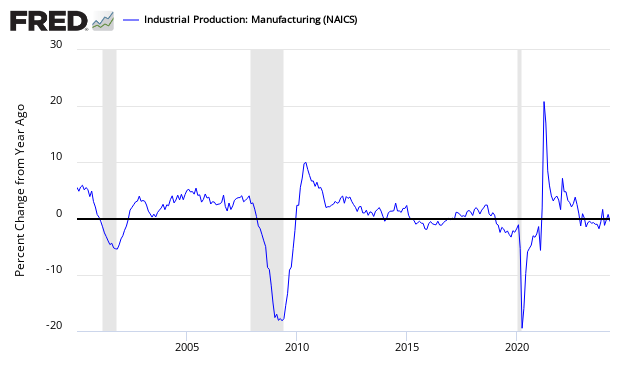
Holding this and other survey’s Econintersect follows accountable for their predictions, the following graph compares the hard data from Industrial Products manufacturing subindex (dark blue bar) and US Census manufacturing shipments (lighter blue bar) to the Kansas City Survey (pea-green bar).
Comparing Surveys to Hard Data


/images/z survey1.png
In the above graphic, hard data is the long bars, and surveys are the short bars. The arrows on the left side are the key to growth or contraction.


