[Editor’s Note: This was posted on the Congressional Budget Website, and adds to the discussion at Econintersect over methods of inflation adjustments to Social Security]
by David Brauer & Noah Meyerson, Congressional Budget Office
As discussed in earlier blog posts, our colleague Jeffrey Kling testified yesterday about changing the measure used to index Social Security, other federal programs, and the tax code for inflation. Currently, the tax code and many federal spending programs are indexed to one of two versions of the consumer price index (CPI): the consumer price index for all urban consumers (CPI-U) or the consumer price index for urban wage earners and clerical workers (CPI-W). Some proposals would switch to using the chained CPI, an alternative measure that grows more slowly than either the CPI-U or CPI-W (which produce similar estimates of inflation) and that many analysts consider to be a more accurate measure of the cost of living for the average person. However, increases in the chained CPI may understate growth in the cost of living for some groups.
In particular, the CPI reflects prices paid for the goods and services purchased by an average household, not by any specific individual or by the average person in certain age groups, income groups, or other categories. Therefore, most people experience price changes that are either higher or lower than reported in the CPI. Computing changes in the cost of living separately for each person would not be feasible, but different indexes could be calculated for subgroups of the population or for different policy purposes. For example, the purchasing patterns of disabled Social Security beneficiaries presumably differ, on average, from those of elderly Social Security beneficiaries, which provides a rationale for indexing Disability Insurance benefits differently from Old-Age and Survivors Insurance benefits.
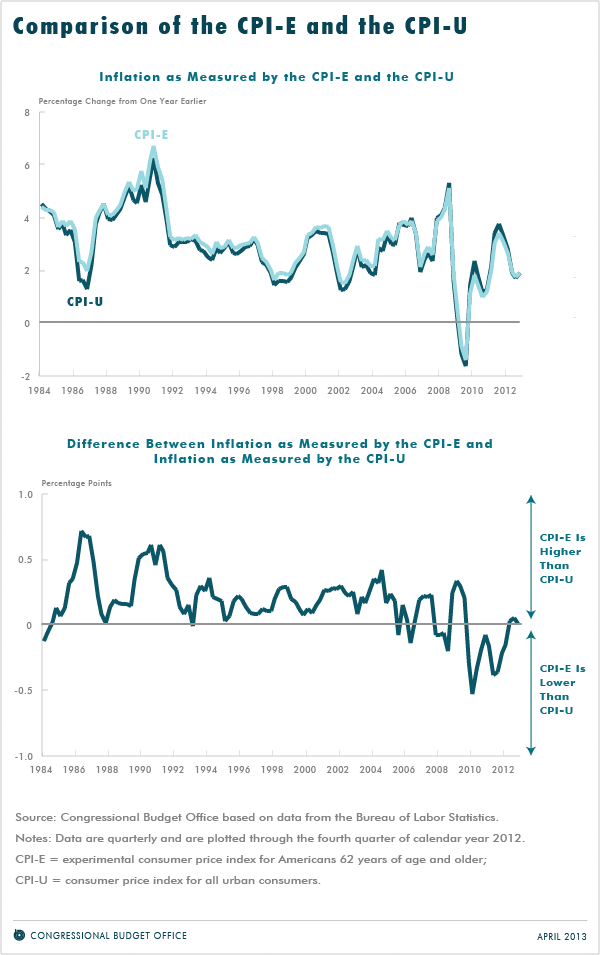
The possibility that the cost of living may grow at a different rate for the elderly than for the rest of the population is of particular concern in choosing a price index for Social Security COLAs because Social Security benefits are the main source of income for many older people. BLS computes an unofficial index that reflects the purchasing patterns of older people, called the experimental CPI for Americans 62 years of age and older (CPI-E). Since 1982 (the earliest date for which that index has been computed), annual inflation as measured by the CPI-E has been 0.2 percentage points higher, on average, than inflation as measured by the traditional CPI-U or the CPI-W. However, since December 2007, when the most recent recession began, inflation as measured by the CPI-E has generally been lower than inflation as measured by the CPI-U or CPI-W (see the figure below).
The longer-term difference between the growth rates of the CPI-E and CPI-U mainly reflects the fact that a larger percentage of spending by the elderly is for items whose prices rise especially quickly. In particular, compared with the overall population, the elderly devote a much larger percentage of their spending to medical care. That difference in spending patterns alone accounts for about half of the long-run difference between the CPI-E and the CPI U.
The other half of the longer-term difference between the growth rates of the CPI-E and CPI-U occurs primarily because other goods and services that receive greater emphasis in the CPI-E have prices that tend to rise at an above-average rate—most notably, housing. Over the past five years, however, the CPI for housing has risen less than the overall CPI has. That situation may be at least partly attributable to the collapse in housing prices that largely resulted from overbuilding during the previous economic boom. Because housing prices have started to rise again and we expect that increase to continue in the coming decade, we anticipate that the CPI-E will outpace the CPI-U in the future.
If policymakers believe that the CPI-E is an appropriate measure of inflation for the elderly, they could use it to index programs that serve that population. A chained version of the CPI-E could also be developed to better account for economic substitution by older consumers, but doing so would require collecting significantly more data about the purchasing patterns of the elderly.
It is unclear, however, whether the cost of living actually grows at a faster rate for the elderly than for younger people, despite the fact that changes in health care prices play a disproportionate role in their cost of living. Determining the impact of rising health care prices on the cost of someone’s standard of living is problematic because it is difficult to measure the prices that individuals actually pay and to accurately account for changes in the quality of health care. (When the price of a good or service changes, it can be difficult to determine what portion of the price growth is attributable to underlying improvements in the quality of the good or service and what portion is attributable to inflation.) Both treatment costs and the value of improved treatments often increase rapidly. Thus, more uncertainty exists about measures of price growth for health care than for other goods and services. Many analysts think that BLS underestimates the rate of improvement in the quality of health care, and some research suggests that such improvement may make the true increase in the price of health care more than 1 percentage point a year smaller, on average, than the increase in that price measured in the CPI. If that is the case, then all versions of the CPI overstate growth in the cost of living, with the overstatement being especially large for the CPI-E because of the large weight on health care in that index. However, if health care increases in both price and quality, the previous lower-quality care may become less accessible, reducing patients’ options for making lower-cost substitutions.
Noah Meyerson is an analyst in CBO’s Health, Retirement, and Long-Term Analysis Division, and David Brauer is an analyst in CBO’s Macroeconomic Analysis Division.


