



So far, all Federal Reserve districts which have released their March surveys are forecasting growth.
Texas factory activity increased in March, according to business executives responding to the Texas Manufacturing Outlook Survey. The production index, a key measure of state manufacturing conditions, rose from 6.2 to 9.9, indicating a slightly faster pace of output growth. The share of manufacturers noting a decrease in production fell to its lowest level in two years.
Other survey measures also suggested a pickup in manufacturing activity, with the new orders and shipments indexes moving up strongly in March after dipping in February. The new orders index came in at 8.7, up from 2.8, and the shipments index rose 8 points to 10.6. The capacity utilization index held steady at 5.5, posting its fourth consecutive positive reading.
Perceptions of broader business conditions improved in March. The general business activity index rose from 2.2 to 7.4, reaching its highest level in a year. The company outlook index moved up from 6.3 to 9.6.
Labor market indicators remained mixed. The employment index has been in positive territory so far in 2013 and edged up to 2.6 in March. Sixteen percent of firms reported hiring new workers compared with 14 percent reporting layoffs. The hours worked index remained slightly negative but ticked up to from –3 to –2.4.
Upward pressure on prices and wages increased slightly in March. The raw materials price index rose to 19.1, up from 15.8 in February. The finished goods price index increased from 4.6 to 7.2, suggesting selling prices rose at a stronger pace in March. The wages and benefits index increased from 12.9 to 18.5, although the great majority of manufacturers continued to note no change in compensation costs. Looking ahead, 44 percent of respondents anticipate further increases in raw materials prices over the next six months, while 27 percent expect higher finished goods prices.
Expectations regarding future business conditions increased in March. The indexes of future general business activity and future company outlook reached their highest levels in five months, coming in at 15.5 and 21.6, respectively. Indexes for future manufacturing activity also rose this month.
Source: Dallas Fed
Summary of all Federal Reserve Districts Manufacturing:
Richmond Fed (hyperlink to reports):

/images/z richmond_man.PNG
Kansas Fed (hyperlink to reports):

/images/z kansas_man.PNG
Dallas Fed (hyperlink to reports):
/images/z dallas_man.PNG
Philly Fed (hyperlink to reports):

/images/z philly fed1.PNG
New York Fed (hyperlink to reports):

/images/z empire1.PNG
Federal Reserve Industrial Production – Actual Data (hyperlink to report)
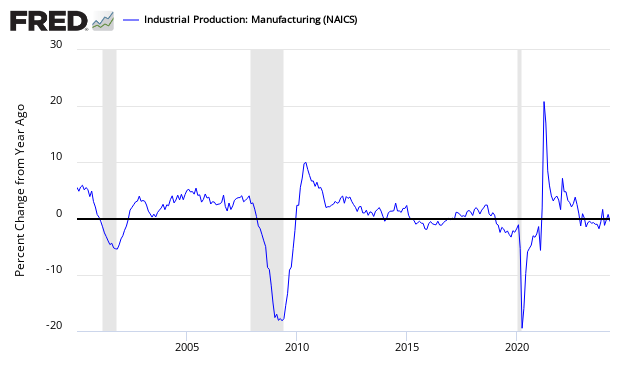
Holding this and other survey’s Econintersect follows accountable for their predictions, the following graph compares the hard data from Industrial Products manufacturing subindex (dark blue bar) and US Census manufacturing shipments (lighter blue bar) to the Dallas Fed survey (light blue bar).
Comparing Surveys to Hard Data


/images/z survey1.png
In the above graphic, hard data is the long bars, and surveys are the short bars. The arrows on the left side are the key to growth or contraction.


