



Manufacturing activity in the central Atlantic region advanced for the second straight month, according to the Richmond Fed’s latest survey. Looking at the broad indicators of activity, new orders were virtually unchanged, shipments grew more slowly, and employment declined. Other indicators were mixed. Capacity utilization turned positive, while backlogs fell further. Moreover, the gauge for delivery times inched higher, while finished goods inventories grew at a slightly slower pace and growth in raw materials inventories edged higher.
Looking forward, assessments of business prospects for the next six months were less optimistic in December. An increasing number of contacts anticipated slower growth for most indicators with the exception of capital expenditures, which grew at a rate slightly above November’s rate.
Survey assessments of current prices indicated that raw materials prices grew on par with November, while finished goods prices grew at a slightly slower rate. Over the next six months, respondents expected raw materials prices to grow at a slightly quicker pace compared to their outlook of last month, while they expected finished goods prices to grow at a slower rate than they had anticipated a month earlier
Current ActivityIn December, the seasonally adjusted composite index of manufacturing activity — our broadest measure of manufacturing — lost four points, settling at 5 from November’s reading of 9. Among the index’s components, shipments fell five points to 6, the gauge for new orders was almost unchanged at 10, and the jobs index turned negative, losing six points to −3.
Other indicators varied. The index for capacity utilization moved higher, adding six points to 3, while the backlogs of orders slipped two points to end at −11. The delivery times index picked up three points to 3, while our gauges for inventories were mixed in December. The raw materials inventory index gained three points to finish at 24, while the finished goods lost seven points to 12.
Read entire source document from Richmond Fed
Summary of all Federal Reserve Districts Manufacturing:
Richmond Fed (hyperlink to reports):
/images/z richmond_man.PNG
Kansas Fed (hyperlink to reports):

/images/z kansas_man.PNG
Dallas Fed (hyperlink to reports):

/images/z dallas_man.PNG
Philly Fed (hyperlink to reports):

/images/z philly fed1.PNG
New York Fed (hyperlink to reports):

/images/z empire1.PNG
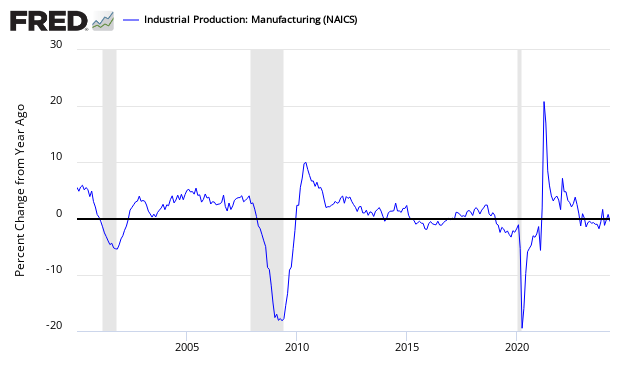
Federal Reserve Industrial Production – Actual Data (hyperlink to report)
Holding this and other survey’s Econintersect follows accountable for their predictions, the following graph compares the hard data from Industrial Products manufacturing subindex (dark blue bar) and US Census manufacturing shipments (lighter blue bar) to the Richmond Fed Survey (dark green bar).
Comparing Surveys to Hard Data


/images/z survey1.png
In the above graphic, hard data is the long bars, and surveys are the short bars. The arrows on the left side are the key to growth or contraction.


