According to the Bureau of Labor Statistics (BLS), this summer the United States experienced its worst drought since the 1980s. The U.S. Department of Agriculture (USDA) estimates that 80 percent of agricultural land in the United States experienced drought conditions in 2012. The dry weather has caused crop failure, and reduced supply. A BLS post examines this issue by comparing today with the events surrounding the 1988 drought.

From the BLS post:
A previous Focus on Prices and Spending article examined the lag between an increase in agricultural prices and an increase in consumers’ grocery bills. The article found that changes in the Producer Price Index (PPI) for processed foods and feeds usually has an impact on the amount consumers pay for food at home 3 to 4 months later. However, periods of drought are considered unusual and may impose a different shock to our food costs, depending on the drought locations and severity.
According to the National Oceanic and Atmospheric Administration’s National Weather Service, the 2012 drought was similar to the 1988 drought, but was more widespread, affecting more states.2 Should the 2012 drought have a bigger impact on grocery prices than the 1988 drought?
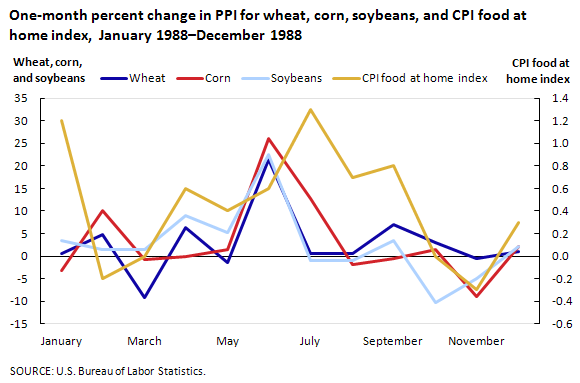
The June 1988 drought resulted in PPI increases of 21.3 percent for wheat, 26.0 percent for corn, and 22.5 percent for soybeans. The PPI for processed foods and feeds increased 2.1 percent in June, and in July, the CPI food at home index increased 1.3 percent—the largest monthly advances for both indexes that year. Charts 1 and 2 show how the drought in 1988 immediately caused a spike in prices for these major crops, and subsequently how much more consumers paid for food.
Chart 1
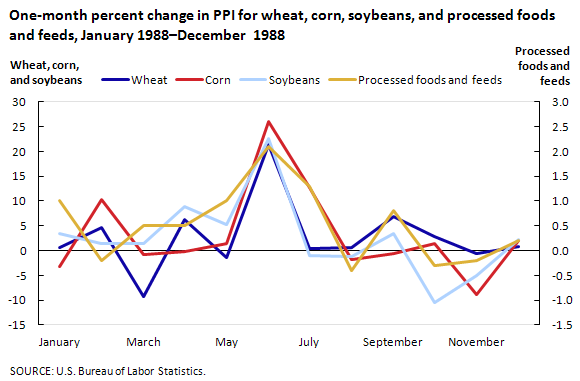
Chart 2
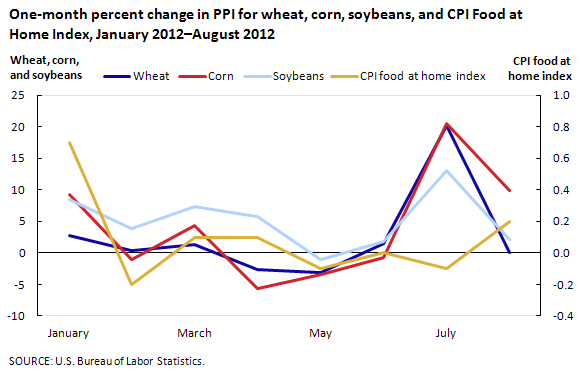
In July 2012, drought again caused a spike in the PPI for wheat (20.2 percent), corn (20.5 percent), and soybeans (13.0 percent). In August 2012, the processed foods and feeds index increased 1.1 percent—the largest rise since August 2011. In contrast, the CPI food at home index advanced only 0.2 percent, compared with the 1.3-percent increase that occurred in July 1988. (See charts 3 and 4.)
Chart 3
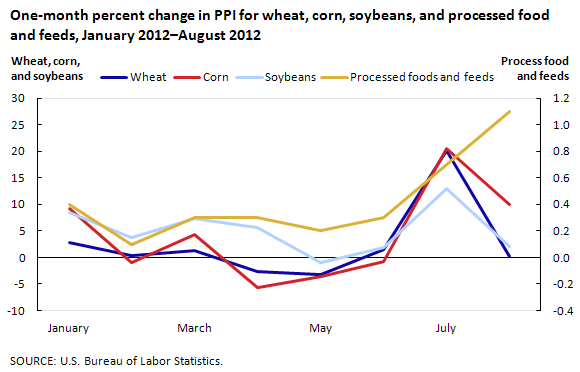
Though the 2012 drought appears more widespread than the 1988 drought, price movements in the indexes for PPI processed foods and feeds and for CPI food at home were not as volatile as they were in 1988. In 1988, processed foods and feeds prices increased immediately with the onset of the drought, but in 2012, there was a 1-month lag. In addition, prices for processed foods and feeds increased 2.1 percent from May 1988 to June 1988, compared with a 1.1-percent rise in prices from July 2012 to August 2012.
Chart 4
In 2012, consumers seem to be protected from extremely high prices because the farming sector is better equipped to withstand drought conditions. Agricultural productivity increased 50 percent between 1982 and 2012; from 1988 to 2012, farm income grew 147 percent, and crop insurance participation was up 60 percent.3 These factors have made farmers more resilient during times of drought and have reduced the amount of price inflation that a drought may cause.4
Although the monthly food price increases were not as severe in 2012 as they were in 1988, increases of over 20 percent for wheat and corn can seem quite alarming, especially considering that these commodities are the main ingredients in many popular food items. However, in order to put these price changes into perspective, an examination of the 12-month percent changes for these commodities is necessary.
From August 1987 to August 1988 prices of wheat increased 48.9 percent and corn prices jumped 90.9 percent. Between September 1987 and September 1988, soybean prices increased 67.4 percent. This means that the drought in 1988 significantly raised commodity prices. In the 2012 drought, the price of wheat increased 8.7 percent, the index for corn advanced 10.3 percent, and soybean prices rose 27.3 percent for the 12-months ended August 2012.
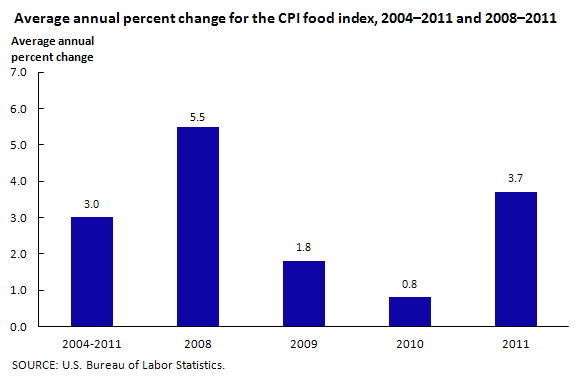
The 12-month percent changes were less extreme in 2012 than in 1988 because in 2012 the economy was experiencing very high commodity price levels just prior to the drought. Commodity prices were high in 2011 because of adverse weather conditions worldwide. Droughts in Russia, Ukraine, and Kazakhstan lowered the global supply of wheat.5 A La Niña weather pattern, characterized by unusually cold ocean temperatures (3-5 degrees Celsius lower than normal), prevailed in 2011 and affected crop yields in Argentina. 6, 7 La Niña also is blamed for Mexico’s crop freeze in 2011 and heavy rains in the United States that delayed planting for corn and soybean crops. Also in 2011, renewed income growth was increasing global food demand. This increase in demand, coupled with lower global supplies put upward pressure on prices of food commodities. These shocks increased prices of commodities well before the 2012 drought. Chart 5 shows that the historical average increase in consumer food prices was 3.0 percent between 2004 and 2011. The USDA forecasts that average annual food price inflation will remain at 3.0 percent in 2012 and inch up to 3.5 percent in 2013, which means that food price inflation should remain around its historical average, despite the 2012 drought.8
Chart 5
Although the summer 2012 drought was the worst since 1988, food price inflation had been relatively robust in the years leading up to 2012. As a result, grocery bills are forecast to be in line with average historical food price inflation. So, although there may have been more dry land and hardships for many farmers, consumers should not notice as severe an impact in their grocery bills as during the 1988 drought.


