 Econintersect: Analysts have expected economic headwinds beginning in the second half of 2011 coming from China, PIIGS, and even the USA States. A new report from the IMF casts doubt on the extent of these cutbacks.
The overall pace of deficit reduction in advanced economies in 2011 will be below earlier estimates. On average, fiscal consolidation among the advanced G20, measured in cyclically adjusted terms, is now projected to equal less than ¼ percent of GDP compared to the 1 percent of GDP projected in November. Their debt ratio is anticipated to rise by almost 5 percentage points, to exceed 107 percent of GDP.
The complete report:
Despite the improving global outlook, the pace of fiscal consolidation this year is slowing in some key countries. The United States and Japan are adopting new stimulus measures and delaying consolidation relative to the pace envisaged in the November 2010 Fiscal Monitor. The underlying fiscal outlook has also weakened in some emerging markets—among them are several that need to build larger fiscal buffers, particularly in the face of surging capital inflows, overheating, and possible contagion from advanced countries. By contrast, advanced economies in Europe are projected to continue tightening policies amid heightened market scrutiny in several countries. Altogether, sovereign risks remain elevated and in some cases have increased since November, underlining the need for more robust and specific medium-term consolidation plans.
Fiscal outturns in 2010 were slightly better than projected, but some large emerging economies underperformed
While advanced economies maintained expansionary fiscal policies on average in 2010, outturns were generally slightly better than projected in the November 2010 Fiscal Monitor. Revenue collection exceeded expectations across most major economies—both output growth and, in some countries, the responsiveness of revenues to output were larger than expected—and spending was lower (Table 1). Overall, the average deficit of advanced economies fell compared with 2009 by about 1 percentage point, to about 8 percent of GDP (0.3 percent better than projected). Excluding the impact of growth and financial sector support, the cyclically adjusted balance widened slightly. Deficits in Germany and the United States were lower than in the November Monitor, reflecting good revenue performance and lower spending—due in Germany to the strong labor market and in the United States to some legislative delays in approving spending and lower financial sector support. Euro-area countries that had targeted large fiscal consolidations generally succeeded in posting marked deficit reductions. Meanwhile, advanced economy gross general government debt continued to rise rapidly in 2010, topping 96 percent of GDP.
Overall emerging economy fiscal deficits were broadly in line with November forecasts, but there were some significant deviations at the country level. Their average headline deficit in 2010 is projected at about 4 percent of GDP, ¾ percentage point lower than in 2009, leaving the average gross general government debt broadly stable at about 37 percent of GDP. The average cyclically adjusted deficit in 2010 was almost unchanged from the previous year. As in advanced economies, revenue collection exceeded expectations, reflecting mainly stronger growth and higher commodity prices, and in some cases sizable one-off receipts (notably the sale of oil concessions in Brazil and auction of telecommunication licenses in India). Higher revenues, however, were generally used to finance higher spending. In part reflecting this, fiscal balances in several key economies (most notably Brazil, China, and India) turned out weaker than projected in the November Monitor (Table 1). Offsetting this, a few countries are expected to realize lower headline and cyclically adjusted deficits than earlier projected, due primarily to higher commodity prices (Russia, Saudi Arabia) and delays in implementing capital expenditure projects (Turkey).
| Table 1. Fiscal Indicators, 2008-12 | |||||||||
| (Percent of GDP) | |||||||||
|
| Est. | Projections |
| Difference from November 2010 Fiscal Monitor | ||||
| 2008 | 2009 | 2010 | 2011 | 2012 | 2010 | 2011 | 2012 | |
Overall Fiscal Balance | |||||||||
Advanced economies | -3.6 | -8.8 | -7.9 | -7.1 | -5.2 | 0.3 | -0.4 | -0.1 | |
United States | -6.5 | -12.7 | -10.6 | -10.8 | -7.2 | 0.5 | -1.1 | -0.5 | |
Euro Area | -2.1 | -6.4 | -6.4 | -4.6 | -4.0 | 0.3 | 0.4 | 0.3 | |
France | -3.3 | -7.6 | -7.7 | -6.0 | -4.9 | 0.3 | 0.0 | -0.2 | |
Germany | 0.0 | -3.0 | -3.5 | -2.6 | -2.3 | 1.0 | 1.1 | 0.7 | |
Italy | -2.7 | -5.2 | -5.0 | -4.3 | -3.5 | 0.1 | 0.0 | 0.1 | |
Spain | -4.1 | -11.1 | -9.3 | -6.6 | -6.0 | 0.0 | 0.4 | 0.3 | |
Japan | -4.1 | -10.1 | -9.4 | -9.1 | -8.0 | 0.2 | -0.2 | 0.1 | |
United Kingdom | -4.9 | -10.3 | -10.3 | -8.1 | -6.1 | -0.1 | 0.0 | 0.3 | |
Canada | 0.1 | -5.5 | -5.9 | -4.7 | -3.3 | -1.0 | -1.8 | -1.2 | |
| |||||||||
Emerging economies | -0.7 | -4.8 | -4.1 | -3.2 | -2.8 | 0.1 | 0.0 | 0.0 | |
China | -0.4 | -3.1 | -3.1 | -2.1 | -1.5 | -0.2 | -0.2 | -0.2 | |
India | -7.9 | -10.2 | -9.8 | -9.2 | -8.4 | -0.2 | -0.4 | 0.1 | |
Russia | 4.3 | -6.2 | -4.2 | -2.9 | -3.0 | 0.6 | 0.7 | -0.1 | |
Brazil1 | -1.4 | -3.1 | -2.6 | -3.1 | -3.2 | -0.9 | -1.9 | -1.5 | |
Mexico | -1.4 | -4.8 | -3.5 | -2.4 | -2.5 | 0.2 | 0.7 | 0.2 | |
South Africa | -0.5 | -5.3 | -5.8 | -5.3 | -4.4 | 0.1 | -0.6 | -1.3 | |
| |||||||||
G-20 advanced | -4.2 | -9.4 | -8.3 | -7.8 | -5.6 | 0.3 | -0.5 | -0.2 | |
G-20 emerging | -0.4 | -4.8 | -3.9 | -3.2 | -2.8 | 0.1 | 0.0 | -0.1 | |
General Government Cyclically Adjusted Balance (Percent of Potential GDP) | |||||||||
Advanced economies | -3.3 | -5.5 | -5.9 | -5.6 | -4.1 | 0.2 | -0.4 | -0.1 | |
United States2 | -4.6 | -6.7 | -7.5 | -8.2 | -5.4 | 0.4 | -1.1 | -0.5 | |
Euro Area | -2.8 | -4.6 | -4.7 | -3.5 | -3.1 | 0.1 | 0.3 | 0.2 | |
France | -3.2 | -5.6 | -6.0 | -4.6 | -3.8 | 0.3 | 0.0 | -0.1 | |
Germany | -1.0 | -1.0 | -2.8 | -2.3 | -2.2 | 0.5 | 0.6 | 0.3 | |
Italy | -2.4 | -3.3 | -3.4 | -2.8 | -2.3 | 0.1 | 0.1 | 0.3 | |
Spain | -5.2 | -9.7 | -7.5 | -5.0 | -5.0 | 0.0 | 0.3 | 0.3 | |
Japan | -3.6 | -6.8 | -7.6 | -7.6 | -7.0 | -0.1 | -0.4 | -0.1 | |
United Kingdom | -5.6 | -8.3 | -8.1 | -6.3 | -4.5 | -0.1 | -0.1 | 0.2 | |
Canada | 0.0 | -3.2 | -4.3 | -3.4 | -2.5 | -0.9 | -1.5 | -0.9 | |
| |||||||||
Emerging economies | -2.4 | -4.6 | -4.3 | -3.6 | -3.3 | -0.2 | -0.2 | -0.3 | |
China | -0.8 | -3.4 | -3.4 | -2.3 | -1.5 | -0.2 | -0.1 | 0.0 | |
India | -10.0 | -10.9 | -10.3 | -9.7 | -8.9 | -0.8 | -0.6 | -0.6 | |
Russia | 3.0 | -3.4 | -2.4 | -1.9 | -2.4 | 0.5 | 0.6 | -0.1 | |
Brazil1 | -2.1 | -2.0 | -2.8 | -3.3 | -3.3 | -1.0 | -2.1 | -1.7 | |
Mexico | -1.0 | -2.7 | -2.7 | -1.9 | -2.1 | 0.1 | 0.4 | 0.0 | |
South Africa | -2.1 | -4.9 | -5.1 | -4.5 | -3.9 | 0.1 | -0.6 | -1.2 | |
| |||||||||
G-20 advanced | -3.4 | -5.5 | -6.1 | -6.1 | -4.4 | 0.2 | -0.6 | -0.2 | |
G-20 emerging | -2.3 | -4.5 | -4.3 | -3.6 | -3.2 | -0.3 | -0.6 | -0.8 | |
| General Government Gross Debt | |||||||||
Advanced economies | 79.2 | 91.4 | 96.5 | 101.0 | 103.6 | -0.9 | -1.0 | -0.8 | |
United States | 71.2 | 84.6 | 91.2 | 97.9 | 102.0 | -1.6 | -1.4 | -1.0 | |
Euro Area | 69.6 | 78.9 | 84.3 | 87.1 | 88.7 | 0.4 | 0.2 | -0.1 | |
France | 67.5 | 78.1 | 84.0 | 87.4 | 89.4 | -0.2 | -0.2 | -0.1 | |
Germany | 66.3 | 73.5 | 76.6 | 77.1 | 77.1 | 1.2 | 0.6 | 0.1 | |
Italy | 106.3 | 116.0 | 118.7 | 120.1 | 120.1 | 0.3 | 0.4 | 0.4 | |
Spain | 39.8 | 53.2 | 63.1 | 68.4 | 72.6 | -0.4 | -1.8 | -2.4 | |
Japan | 195.0 | 217.4 | 220.7 | 227.5 | 232.8 | -5.1 | -6.6 | -5.8 | |
United Kingdom | 52.0 | 68.3 | 77.2 | 82.1 | 84.5 | 0.6 | 0.2 | -0.6 | |
Canada | 71.3 | 82.5 | 83.9 | 85.4 | 84.8 | 2.2 | 4.9 | 6.0 | |
Emerging economies | 35.4 | 37.2 | 36.9 | 36.8 | 36.4 | -0.5 | -0.5 | -0.5 | |
China | 17.0 | 17.7 | 18.4 | 18.1 | 17.6 | -0.8 | -0.7 | -0.5 | |
India | 74.0 | 77.8 | 75.7 | 75.2 | 74.8 | 0.6 | 1.1 | 1.2 | |
Russia | 7.8 | 10.9 | 10.4 | 10.8 | 12.1 | -0.6 | -2.0 | -2.4 | |
Brazil | 70.7 | 67.9 | 65.7 | 67.5 | 66.9 | -1.1 | 0.9 | 0.5 | |
Mexico | 43.0 | 44.6 | 44.5 | 45.0 | 43.9 | -0.5 | -0.7 | -1.0 | |
South Africa | 27.3 | 31.5 | 35.9 | 39.5 | 41.6 | 0.9 | 1.4 | 1.9 | |
G-20 advanced | 84.5 | 97.6 | 102.7 | 107.4 | 110.2 | -1.1 | -1.2 | -1.0 | |
G-20 emerging | 35.2 | 36.4 | 35.6 | 35.3 | 34.9 | -0.7 | -0.7 | -0.8 | |
| Sources: January 2011 WEO; and IMF staff calculations. All country averages are PPP-GDP weighted using 2009 weights. 1 Fiscal balances do not include policy lending to the Brazil’s development bank exceeding 3 percent of GDP in both 2009 and 2010. 2 Excluding financial sector support recorded above the line. | |||||||||
The pace of fiscal consolidation in 2011 is now projected to be slower on average, and more varied across countries
The overall pace of deficit reduction in advanced economies in 2011 will be below earlier estimates. On average, fiscal consolidation among the advanced G20, measured in cyclically adjusted terms, is now projected to equal less than ¼ percent of GDP compared to the 1 percent of GDP projected in November. Their debt ratio is anticipated to rise by almost 5 percentage points, to exceed 107 percent of GDP.
- The U.S. Congress approved a stimulus package in December featuring income and payroll tax cuts and extended unemployment benefits (Table 2). While some targeted measures to address the weak state of labor and housing markets are justifiable, the package’s composition means that its stimulative impact will be small, relative to its fiscal cost (see January 2011 WEO Update). Combined with the better-than-expected 2010 outturn, the new measures mean that the deficit is expected to increase slightly this year, compared to the decline of 1½ percent of GDP forecast in November. The United States will be the only major advanced economy implementing procyclical fiscal policies this year, albeit in the face of a still-sizable output gap (Figure 1). Moreover, getting on track to achieve the Toronto Declaration commitment to halve the deficit by 2013 will require a significant adjustment next year. In this respect, the 2012 deficit forecast is consistent with the targets spelled out in the recent mid-session budget review. Furthermore, progress on developing a medium-term consolidation plan has been slow: the final report of the President’s Fiscal Commission succeeded in laying out a comprehensive strategy of discretionary spending cuts and tax and entitlement reforms but failed to garner the supermajority support needed to formally submit its report to Congress.

- In Japan, the already-modest narrowing of the overall deficit planned for 2011 has been reduced after the Diet approved expenditure increases. A proposed corporate tax cut is expected to be offset by other revenue measures (Table 2). A deficit reduction of about 1 percent of GDP is projected for 2012.
- The largest European countries, in contrast, will all consolidate in 2011, broadly in line with earlier plans. Withdrawal of fiscal stimulus in Germany and France, combined with discretionary measures and higher growth, will contribute to a notably lower deficit. Spain’s deficit reduction will be the most pronounced among the large European countries, and will rely heavily on expenditure measures, including cuts in wages, pensions, and public investment. In the United Kingdom, in addition to significant fiscal tightening in 2011, the government announced detailed plans to reduce public expenditure over the next four years. All these countries are projected to further improve their fiscal positions in 2012.
- Greece, Ireland, and Portugal will continue with sizable frontloaded consolidation. These efforts should translate into large improvements of both the headline and cyclically adjusted balances (averaging 2 and 2¾ percentage points of GDP, respectively), reflecting mainly expenditure cuts (including public payrolls, pensions, and/or transfers). Further progress in deficit reduction is also projected in these countries in 2012.
| Table 2. Selected Advanced Economies: Policy Measures Adopted or Announced since the November (Announced impact on 2011 general government balance in percent of GDP) | |||
| Country | Revenue and other receipts | Expenditure | Total |
| Fiscal tightening | |||
| Greece | Various measures to speed up tax arrears and tax penalty collection, measures against fuel smuggling, improved collection efficiency, renewal of Telecom licenses, extension of airport concessions (1.0 percent of GDP) | Wage cuts and tariff increases in public enterprises, cost savings and increases in co-pay for hospitals, means-testing of family benefits. Reductions in: transfers and operational expenditures; short-term contracts in the public sector; military deliveries (1.2 percent of GDP). | 2.2 |
| Ireland | Revisions to PIT bands and credits; integration of health and income levies into universal social charge; tightening of various tax reliefs on private pensions contributions; and reduction in tax expenditures (0.9 percent of GDP) | Reduction in public payroll and discretionary expenditure, non-progressive social welfare benefits and capital spending (2.4 percent of GDP) | 3.5 |
| Portugal 1 | Increase in VAT by additional 2 percentage points, and cuts in tax expenditures (0.8 percent of GDP) | Reduction in public wages, pensions and social transfers (2.2 percent of GDP) | 3.0 |
| Spain 2 | Increase in the tobacco excise tax and the partial privatization of the National Lottery and the airport management company | Reduction in subsidies to wind-power producers and reduction in unemployment benefit transfers | … |
| Fiscal stimulus | |||
| Japan 3 | Reduction of effective corporate tax by 5 pps to 35 percent offset by reducing deductions for income and inheritance taxes, and raising fuel levies (0.1 percent of GDP). | Increase in capital spending to local economies and transfers to SME, employment support programs, childcare and healthcare (1.0 percent of GDP) | 1.1 |
| United States 4 | Two-year extension of the 2001 and 2003 tax cuts; one-year 2 pps reduction in employee payroll tax, extension of the 2009 estate tax regime and accelerated depreciation (0.8 percent of GDP) | 13-month renewal of emergency unemployment benefits (0.1 percent of GDP) | 0.9 |
| 1 Despite the adoption of these new measures, the total deficit target for 2011 (4.6 percent of GDP) is unchanged. 2 Estimated impact of these measures on the fiscal balance is not available. 3 Due to better-than-expected revenue performance, the deficit is expected to increase only by 0.2 percent of GDP in 2011 relative to November 2010 forecast 4 Impact on fiscal-year federal deficit relative to previous IMF staff policy assumptions. | |||
Consolidation in emerging G20 economies is expected to continue, but cross-country differences within this group are becoming more pronounced, as well. The average deficit in 2011 is expected to decline by about ¾ percent of GDP, enough to keep the average gross general government debt ratio constant. While this is roughly unchanged from the November Monitor, variation across countries has increased considerably. Some commodity exporters (Russia, Saudi Arabia) are likely to perform better than initially expected, owing to sizable revenue windfalls. However, fiscal deficits in some key emerging economies are expected to be higher than in the November Monitor, due to the carryover of spending committed in the second half of 2010 (Brazil and, to a lesser extent, China) or the non-recurrence of certain receipts from last year (Brazil, India). The deterioration in Brazil’s fiscal accounts is particularly pronounced, and the government is now expected to miss its fiscal target (a primary balance of about 3 percent of GDP) by a wide margin.
Progress in fostering institutions aimed at supporting fiscal sustainability has been mixed, and existing frameworks have in some cases been weakened. The newly elected U.S. House of Representatives adopted procedural rules that constrain expenditure growth but leave the door open to deficit-financed tax cuts and tax expenditures. Conversely, the strengthening of the euro area fiscal framework continues apace, with the procedures leading to an improved Stability and Growth Pact, and the implementation of the European semester, advancing as planned. The European Council has cleared the way for the creation of a permanent crisis management and resolution arrangement: the European Stability Mechanism (ESM). By June 2013, the ESM will combine a liquidity-provision arm similar to the European Financial Stability Facility (EFSF) with a crisis resolution procedure that will mandate bondholder bail-in for any country deemed insolvent. In Hungary, the non-partisan fiscal watchdog was closed, undermining transparency and weakening checks and balances.
Despite rising sovereign bond yields and eroding fiscal frameworks in some countries, severe market pressures have remained limited to some euro area countries
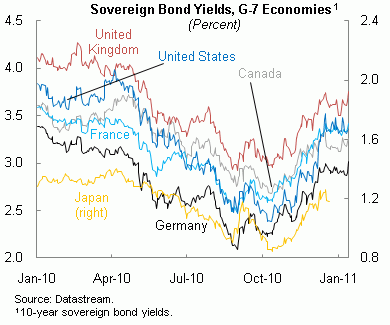
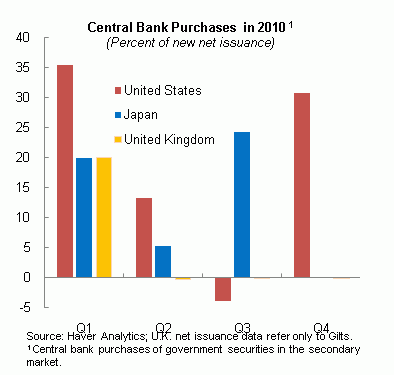
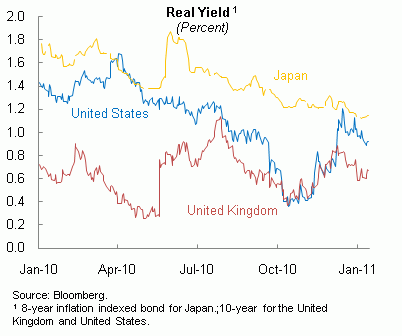
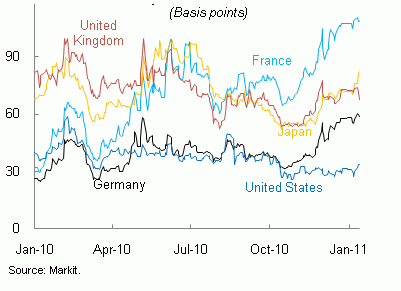
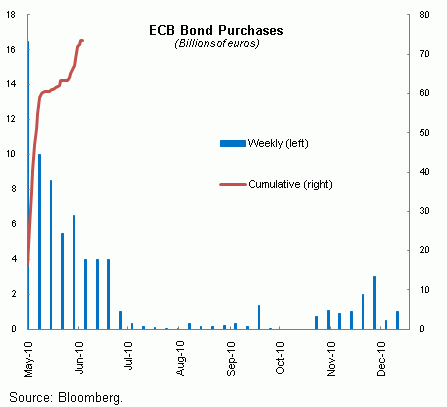
Government bond yields in all major advanced economies have increased. Since early November, nominal yields on United States government paper have jumped 80 basis points at 10-year maturities, followed by similar increases elsewhere (except Japan, where a large and stable domestic investor base, and continued sluggish growth and deflation, have likely contributed to what has been a more moderate move) (Figure 2, panel 1). These upticks in yields occurred at a time of rising government bond purchases by major central banks (Figure 2, panel 2; (Figure 3, panel 2). In the United States, a gradual normalization of real interest rates (Figure 2, panel 3) in the wake of stronger growth prospects and rising equity prices is likely a key driver of these developments. Indeed, inflation expectations remained broadly well-anchored and CDS spreads stayed essentially flat in the United States (Figure 2, panel 4). The situation in Germany and France is similar, although some uptick in sovereign CDS spreads in these countries may signal increased market concerns about the fiscal price tag of additional banking sector support and contingent liabilities that these countries could be taking on in the context of the EFSF. In the meantime, intensified market pressure has so far remained limited to a small number of euro area member states (Figure 3, panel 1).
In emerging markets, large capital inflows and correspondingly easy credit conditions risk discouraging the accumulation of sufficient fiscal buffers. As discussed in the WEO and GFSR Updates, the intensity and nature of these inflows carries risks. On the fiscal side, persistently loose credit conditions and the emergence of asset market exuberance are known to encourage procyclical increases in public expenditure, as booming tax revenues and lower interest payments create transitory fiscal space.
Large rollover needs for public and private sector debt are projected for 2011. Pressures will be especially high during the first half of the year, with euro-area countries competing with about $5 trillion in sovereign rollover needs in other advanced economies (Figure 4). This will be compounded by large funding requirements from financial groups in many countries (see January 2011 GFSR Update).
Heightened market scrutiny and delayed consolidation make it even more essential for governments to signal a clear commitment to long-term sustainability
Attempts to soften supporting institutional arrangements need to be resisted. Strong and transparent fiscal and budgetary institutions will be critical for sustaining the needed medium-term adjustment and enhancing policy credibility.
- Renewed market pressures in some advanced economies demand that these countries underline their commitment to their deficit targets and devise contingency plans to ensure that adjustment goals are met. In the euro area, a more comprehensive approach to crisis management is needed that could break the fiscal-financial spiral and reduce the risk of cross-border contagion. In advanced economies where fiscal sustainability has not been a market concern, credible plans going well beyond 2011 need to be put in place urgently to lock in benevolent market sentiment. The United States and Japan where fiscal adjustment has now been delayed relative to the pace envisaged in the November 2010 Fiscal Monitor, need in particular to strengthen their adjustment credentials by detailing the measures they intend to adopt to honor their commitments to reduce deficits and debt.
- Many emerging economies need to rebuild fiscal buffers more rapidly to address overheating concerns; create scope to respond to any growth slowdown; or avoid relapsing into procyclical policies that would undermine credibility. Spending pressures should be resisted, and revenue overperformance saved in full.


