Written by John Lounsbury
The concept used in economics for a “depression” is inexact and in conflict with the physical definition of the term. We will propose an analytically precise definition of the term and show a number of examples of how the new definition works in examining the business cycle.

There is a commonly used definition for an economic depression. From Wikipedia:
In economics, a depression is a sustained, long-term downturn in economic activity in one or more economies. It is a more severe downturn than an economic recession, which is a slowdown in economic activity over the course of a normal business cycle.
A depression is an unusual and extreme form of recession.
This essay will argue that this accepted definition is inappropriate.
Let us consider the general definition of depression from The Free Dictionary:
de·pres·sion (dĭ-prĕsh′ən)
n.1.a. The act of depressing.b. The condition of being depressed.2. An area that is sunk below its surroundings; a hollow.
A physical depression is a hollow. It is not the drop into a hollow from any one direction. It is the surface followed from any point of the surroundings into and out of the hollow.
Going into this hollow is a process of recessing below the surroundings and coming out of the hollow is a process of recovering to the surroundings.
Thus, in an economic downturn, an economy recesses until a bottom is reached in specified economic variables. Then the other side of the hollow is traversed as the economy recovers until the “surrounding” level is reached.
Consider the sinkhole depression pictured below. If you approach this depression from the left and start down the wall you are recessing into the depression. After crossing the bottom to climb the slope on the right hand side, you are recovering to the level of the surrounding ground. The entire process constitutes trans-versing the depression.

The depression can be shallow or deep – it is still a depression.
It is in this sense that we propose to refine the definition of an economic depressions to be consistent with the physical definition described above:
An economic depression is a recession of economic activity followed by a recovery to the pre-depression level.
Every recession is part of a depression, be it a small one or a large one, like The Great Depression of the 1930s.
A depression always has at least one recession; there can be two or more recessions in a given depression.
The rest of this article is from a piece posted by this author over 6 1/2 years ago:
Time to Take a Fresh Look at the Business Cycle (Seeking Alpha, 10 February, 2010)
The term “business cycle” refers to the cyclic nature of economic activity. The following definition comes from Investopedia:
What Does Business Cycle Mean?
The recurring and fluctuating levels of economic activity that an economy experiences over a long period of time. The five stages of the business are growth (expansion), peak, recession (contraction), trough and recovery. At one time, business cycles were thought to be extremely regular, with predictable durations, but today they are widely believed to be irregular, varying in frequency, magnitude and duration.
Wikipedia provides a more extended discussion of the business cycle, which it summarizes as comprised of periods of expansion separated by periods of contraction.
John Smith, at Associated Content.com, gives the most common definition of the stages of the business cycle: expansion, contraction and recovery.
These definitions are very basic, but we need to think about these as we take an analytical look at the business cycle. One thing will become clear in the following discussion: the business cycle is composed of events and processes. Some descriptions of the business cycle confuse these two things (events and processes).
The Traditional Business Cycle
The concept of recessions is based on the idea of the business cycle. The classical diagram to summarize the business cycle often looks like the following graph.
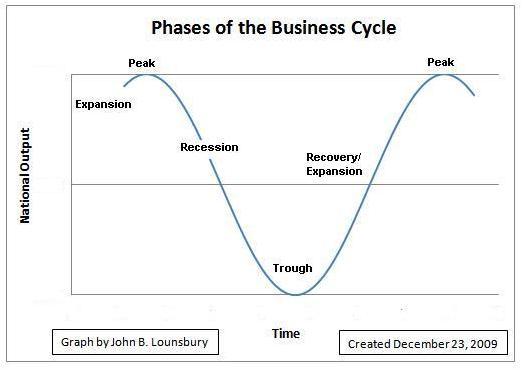
This is far from the shape of real business cycle because the expansions and contractions are often of much different durations in time and the trend through several business cycles almost always has a non-zero slope, often upwards. Most of the time, but not all, the second peak is at a higher level of economic activity that the preceding one.
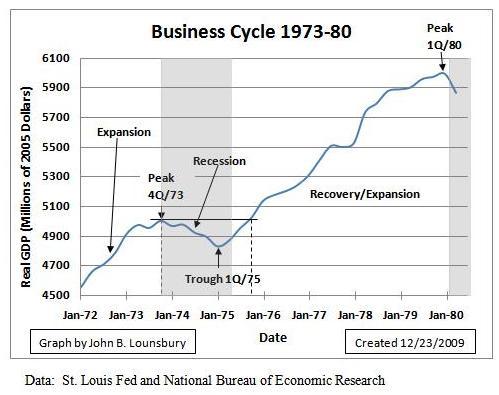
An example of a business cycle is shown in the following graph for the recession of 1973-75, following the value of real GDP. The shaded gray area indicates the NBER (National Bureau of Economic Research) defined recession.
 As we proceed forward, it is important to distinguish between processes (which occur over a period of time) and events (which occur at a point in time). Processes are expansion and recession. Events are peaks and troughs. Throughout some discussions I find that events and processes are used in definitions without distinction regarding the time dependent factor. It is important in the discussion that follows to focus on the differences between processes and events.
The New Business Cycle
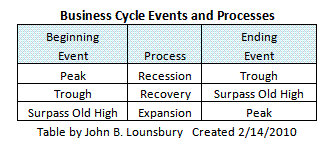
The business cycle could be much better defined if the recovery and expansion phases were identified as two individual steps. The recovery ends and expansion begins when the economic variable (in this discussion GDP) recovers to the level of the previous peak. In the introduction, only the definition given by John Smith clearly identifies recovery and expansion as two separate processes. They are linked by an event, the surpassing of the prior peak. The expansion does not begin until new highs are achieved; gains from the trough simply recover what had been produced in the previous expansion until the prior peak is equaled. The following table shows these relationships:
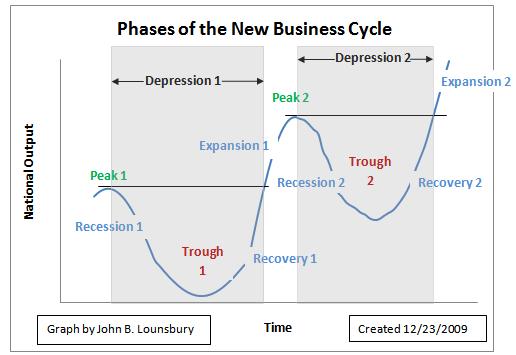
In the above graph, the recovery would be complete in 3Q/75. The new expansion takes place from 4Q/75 to 1Q/80. The following graph shows the type of illustration that would give a better representation of the business cycle.
Defining Recession and Depression
Using the new business cycle definitions enables a precise definition of recession and depression:
- Recession is the economic contraction from peak to trough.
- Depression is the cycle from an economic peak through a trough and back to the level of the preceding peak (recession plus recovery).
- Thus every recession is part of a depression.
This is not an idea that exists only in my mind. In fact, it may underlie a lot of economic thinking. Very recently, for example, I saw statements in an article by Edward Harrison that referred to the current projected slow recovery as a depression. I do believe the concept can stand further clarification and, with that, add to better characterization of various business cycles.
The following table gives the peak, trough, recovery and expansion (to the next peak) dates associated with recessions since the late 1940s, using real GDP as the measure of economic activity.
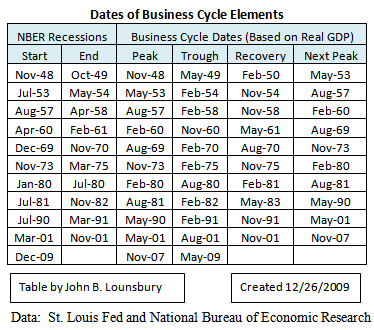
GDP data is quarterly. The month designated in the above table is the middle month of the applicable quarter. Thus the only months listed for the business cycle dates are February, May, August and November.
The duration of official recessions (NBER designations), as well as the durations of business cycle recessions, recoveries, depressions and expansions as measured by real GDP are shown in the following table.
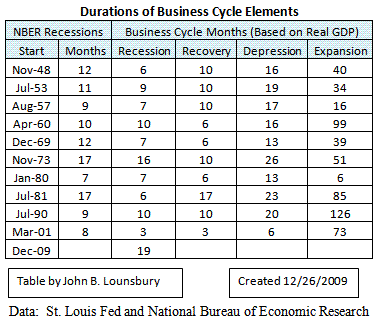
Some observations:
- All NBER official recessions have been equal to or longer than the business cycle recessions (based on real GDP) except for the recession of 1990-91.
- There have been four recoveries that took longer than the associated business cycle recessions.
- There have been four recoveries that were quicker than the associated business cycle recessions.
- The last two completed business cycles had recessions and recoveries of equal length.
- All business cycle depressions have been of longer duration than official recessions, except for the 2001 recession.
- The average duration of official recessions (NBER) has been 11.6 months (1948-1990), with a standard deviation of 3.5 months. The 2001 recession lasted 8 months. This data point belongs to same distribution as the previous recessions.
- The average duration of business cycle depressions based on GDP has been 18.1 months (1948-90), with a standard deviation of 4.4 months. The 2001 depression lasted 6 months. This is a clearly an outlier from the previous depressions.
Summary
There has been a lot missed in understanding the cyclic behavior of the economy by not making precise definitions. A remedy has been attempted here. While this discussion has been trivial for academic macroeconomists (but I hope not for all of my readers), these trivialities must be clearly understood to appreciate what I will try to discuss in upcoming articles.
Author’s note (2016)
This is the first of series of articles which will discuss how these definitions can be quantified for the classification of economic cycles, applied to past cycles and then used for analysis in future cycles as they unfold.


