Written by Steven Hansen
This past week, the electoral college confirmed Donald Trump was going to be the next USA President. He did not win the majority of popular votes cast – but won the majority of electors in the system designed by the founding fathers which was intended to prevent the more populous states from dominating the election process. Much of our economic policies seemed geared towards higher population areas, and falling short in rural America.

This post is a departure from my normal process of drilling down into the economic data and showing hidden trends. In this post, I acknowledge that the data lacks clarity and there can be many ways of postulating what it means.
Here is the infamous Washington Post post election map showing the counties won by President-elect Trump (red) and Hillary Clinton (blue).
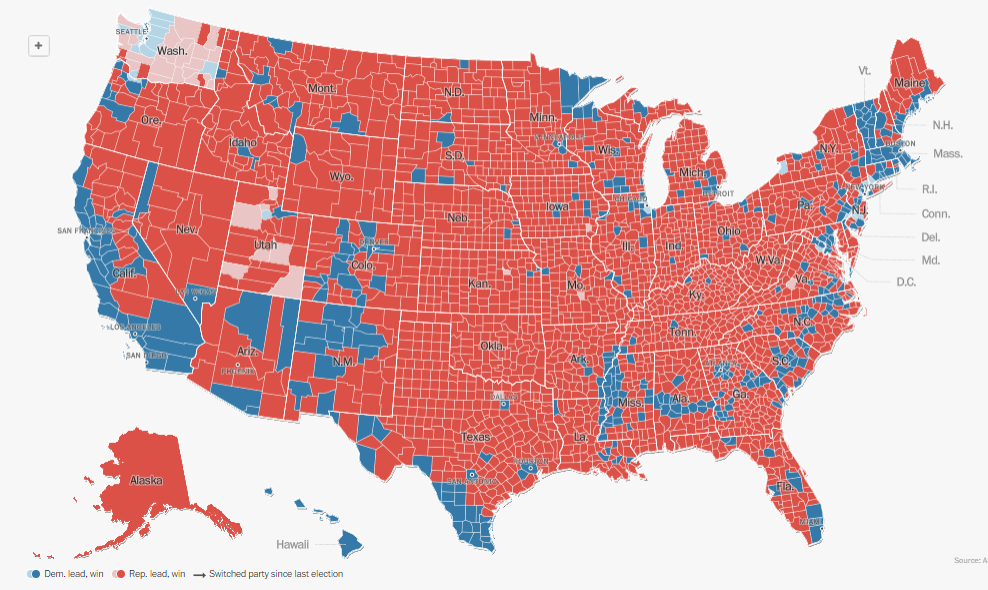
What struck me is that generally since 1984 – this pattern of rural Vs. populated voting patterns existed (exception was President Bill Clinton’s election years). Many are pushing the idea is that there is a problem with the Democratic Party agenda. I say hardly anybody votes against their pocketbook – and for most voters will vote for what is working (or what they think will work better).
I postulate that the red on the above map is the perceived failure of economic policies in that area. The majority of people who live in the red areas do not see the current economic policies working for them – and did not want a President offering more of the same.
Yes, the USA is divided – but it is divided economically – not necessarily along party lines. Of course there are a percentage of Americans who vote on party lines regardless of the candidate but these would be a minority.
Systems must be designed to be flexible. A country wide minimum wage law likely is good news in Dallas – but it sucks in Yulee, Georgia where the population just wants jobs at almost any wage.
There are 50 states with some 3,000+ counties – and they are NOT the same. Yet the USA passes laws and policies which impose the same policies in all 3,000 counties.
The federal government system as designed recognized needs were different depending on where you lived – but recently the Central government (executive, congress and supreme court) decided everyone was the same – no matter where you lived.
From an economic point of view, having 3,000 counties and 50 states competing against each other creates a process of optimizing systems – and allows discovery of what works the best so other counties and states can copy.
I consider that the red on the map above demonstrates a failure of the economic polices for the more rural areas in the USA. This is the wake-up call for Washington politics.
Other Economic News this Week:
The Econintersect Economic Index for December 2016 improved but still with the economic outlook for weak growth. The index remains near the lowest value since the end of the Great Recession. This month there are no recession warning flags. Six-month employment growth forecast indicates minor improvement in the rate of growth.
Bankruptcies this Week from bankruptcydata.com: Modular Space, Dakota Plains


