by James D. Hamilton, Econbrowser.com
Appeared originally at Econbrowser 29 January 2016
The Bureau of Economic Analysis announced today that U.S. real GDP grew at a 0.7% annual rate in the fourth quarter. That’s a bad quarter to be sure, and real GDP is up only 1.8% from a year ago. That’s a weak year judged by the U.S. postwar average of 3.1%, but is not far from the 2.1% annual growth we’ve been averaging since 2009:Q3.

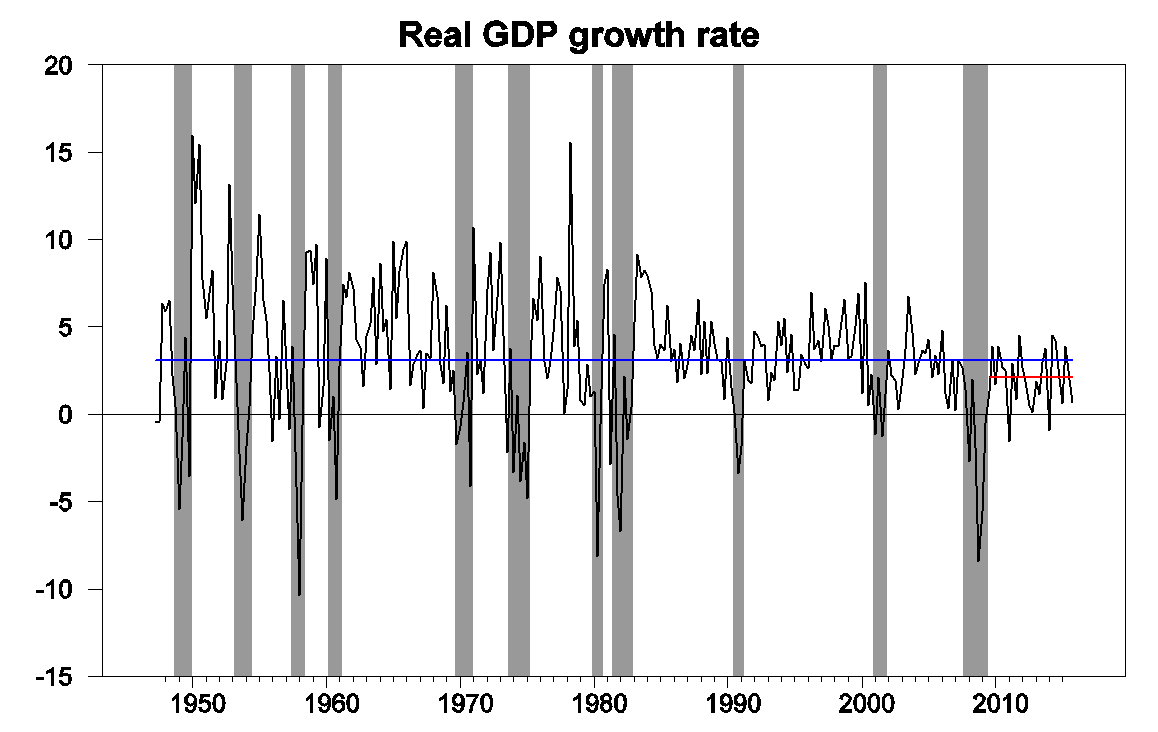
Real GDP growth at an annual rate, 1947:Q2-2015:Q4, with historical average (3.1%) in blue and post-Great-Recession average (2.1%) in red.
One concerning detail in today’s report was that nonresidential fixed investment fell during the quarter, pulled down in part by slashed capital spending in the oil patch. Inventory drawdown (often an erratic component) and net exports each subtracted almost half a percentage point from the annualized Q4 growth rate.
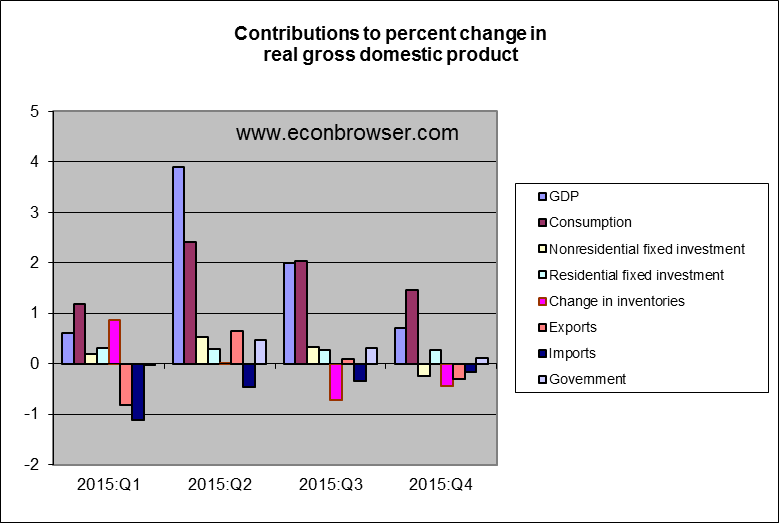
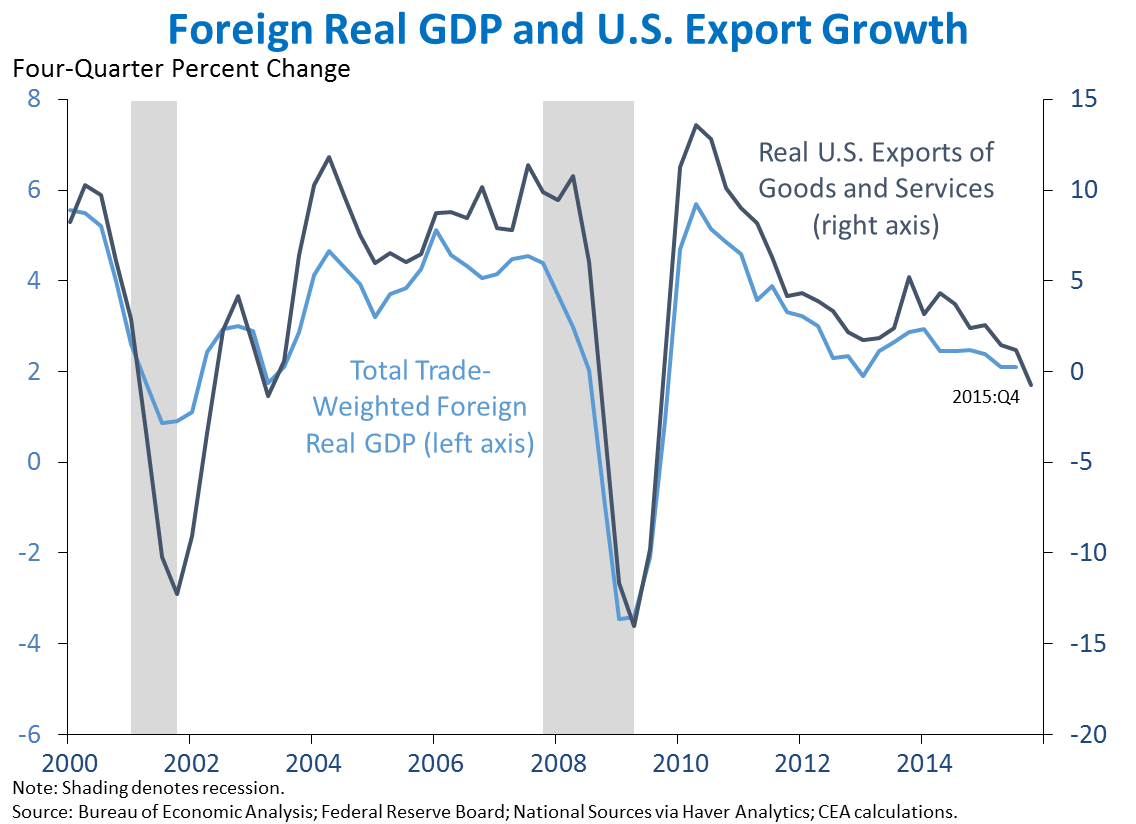
Weakness in the global economy and strong dollar were surely factors in the drop in net exports. The U.S. is not immune to developing concerns in Europe, China, Japan, and elsewhere.
Source: Jason Furman.
The Q4 GDP numbers produced a modest increase in the Econbrowser Recession Indicator Index up to 10%. The index uses today’s data release to form a picture of where the economy stood as of the end of 2015:Q3. That’s still way below the 67% threshold at which our algorithm would declare that the U.S. had entered a new recession.
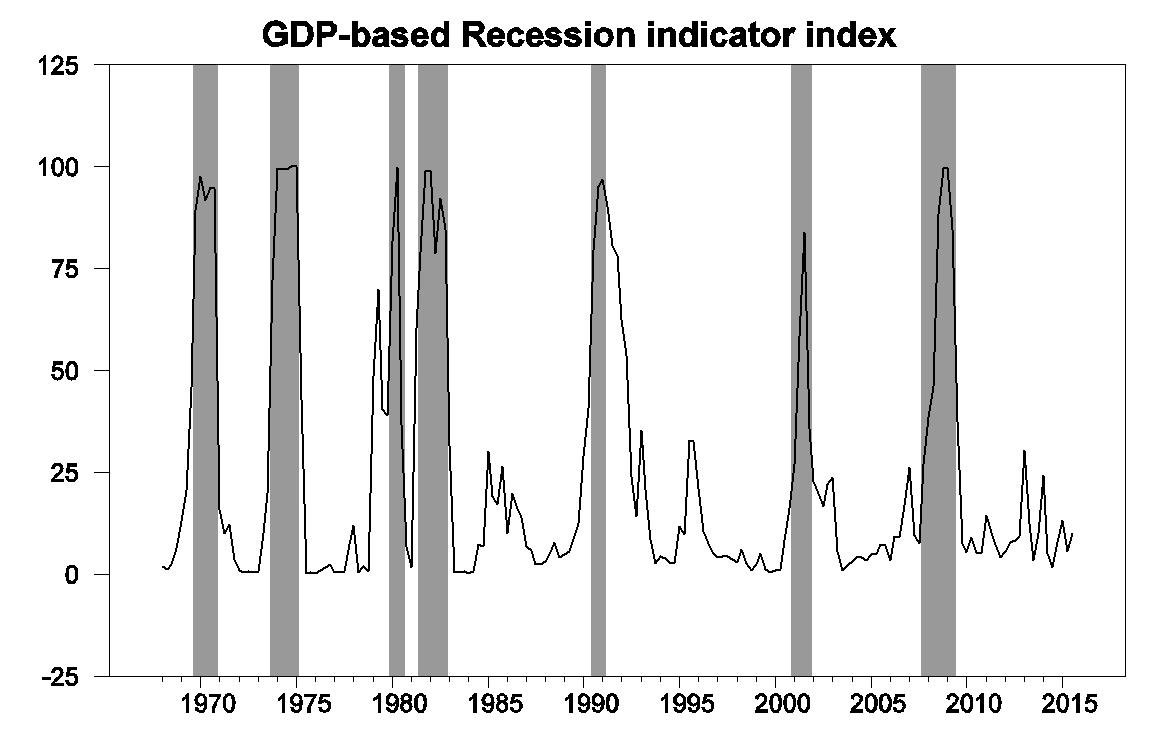
GDP-based recession indicator index. The plotted value for each date is based solely on information as it would have been publicly available and reported as of one quarter after the indicated date, with 2015:Q3 the last date shown on the graph. Shaded regions represent the NBER’s dates for recessions, which dates were not used in any way in constructing the index, and which were sometimes not reported until two years after the date.
With much talk of recession in the air these days, I was curious to look at some other indicators. UCLA Professor Ed Leamer suggested four useful rules of thumb. He noted that a recession is usually characterized by an increase in the unemployment rate of 0.8 percentage points over a 6-month period. Today’s unemployment rate is actually 0.3% lower than it was in June.
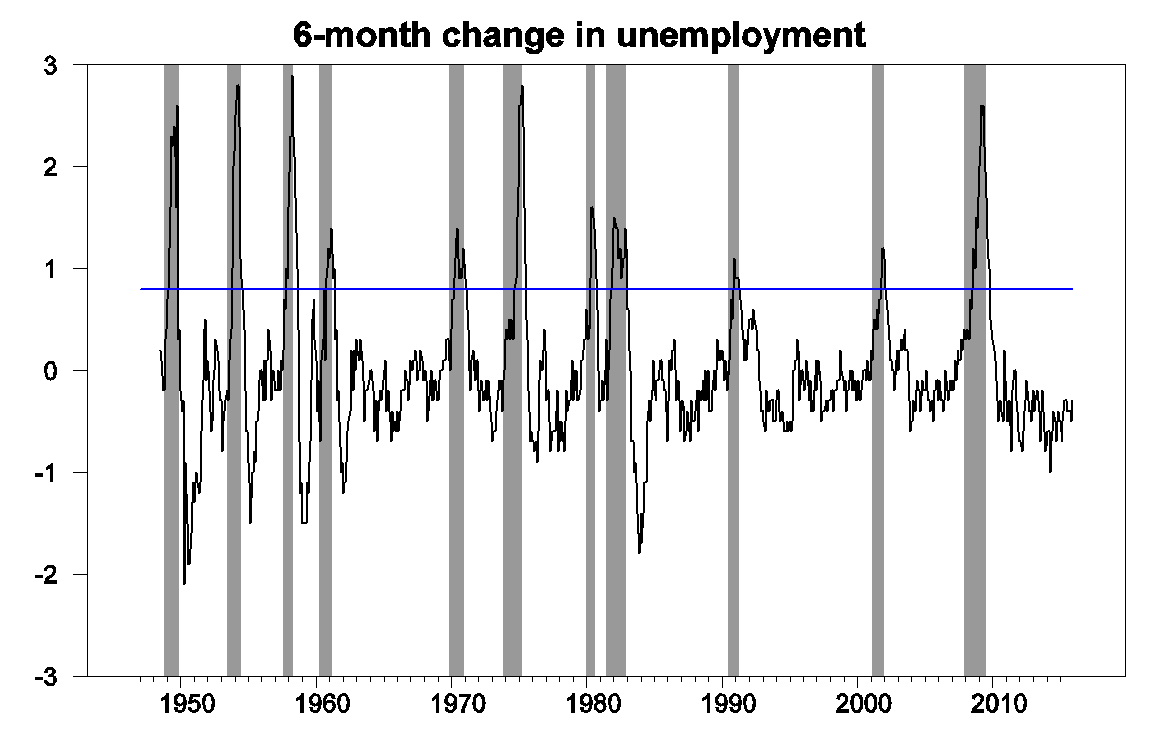
6-month change in civilian unemployment rate, from FRED, with NBER recessions as shaded regions and blue line at +0.8 threshold.
In a recession we’d likely see payrolls of nonfarm establishments fall by more than 0.5% over a 6-month period. They’re up 1% over the last 6 months.
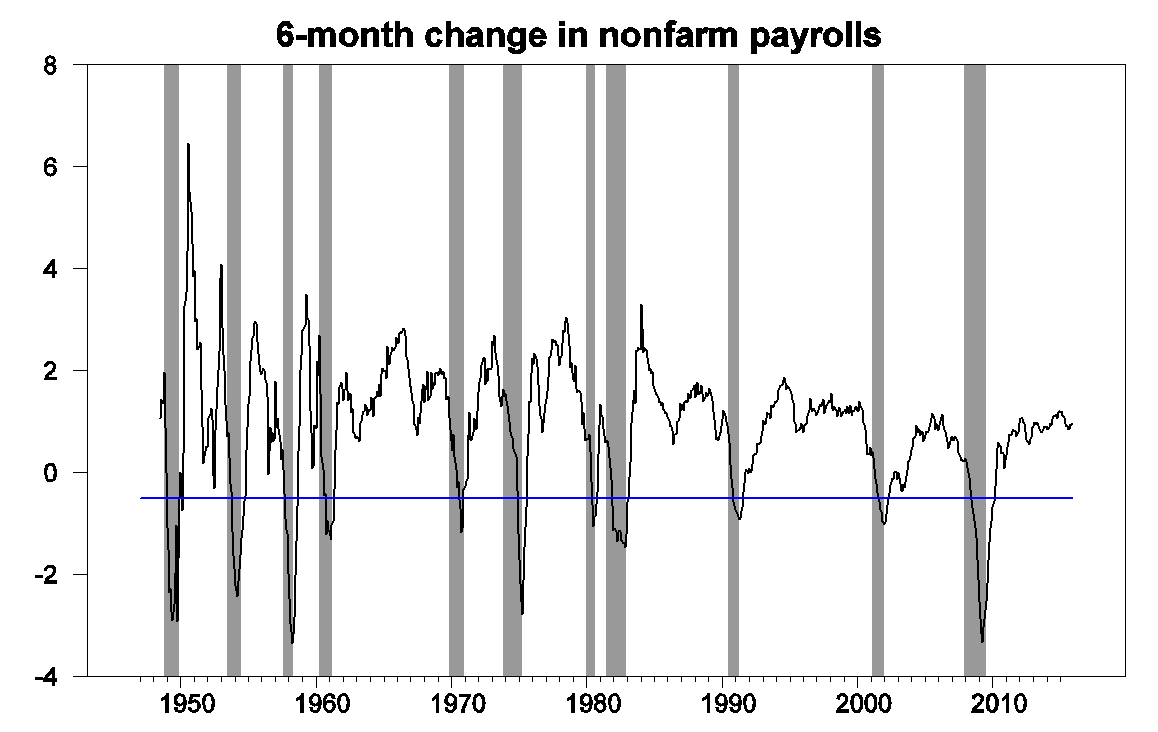
100 times the 6-month change in natural log of seasonally adjusted nonfarm payroll employment, from FRED, with NBER recessions as shaded regions and blue line at -0.5% threshold.
The separate BLS measure of employment based on their survey of households is up 0.8%.
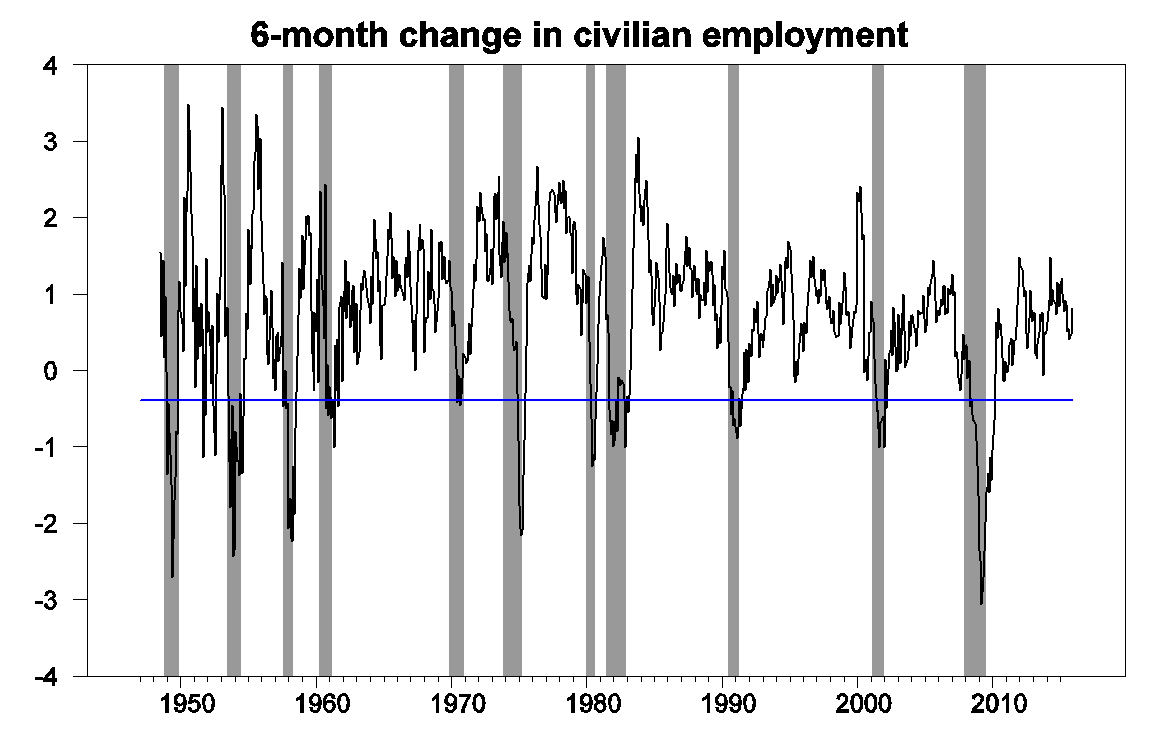
100 times the 6-month change in natural log of civilian employment,from FRED, with NBER recessions as shaded regions and blue line at -0.4 threshold.
Leamer’s fourth suggested indicator, the Federal Reserve’s index of industrial production is down 0.6% over the last 6 months. But Leamer wanted to see a 6-month drop of more than 3% before calling it a recession.
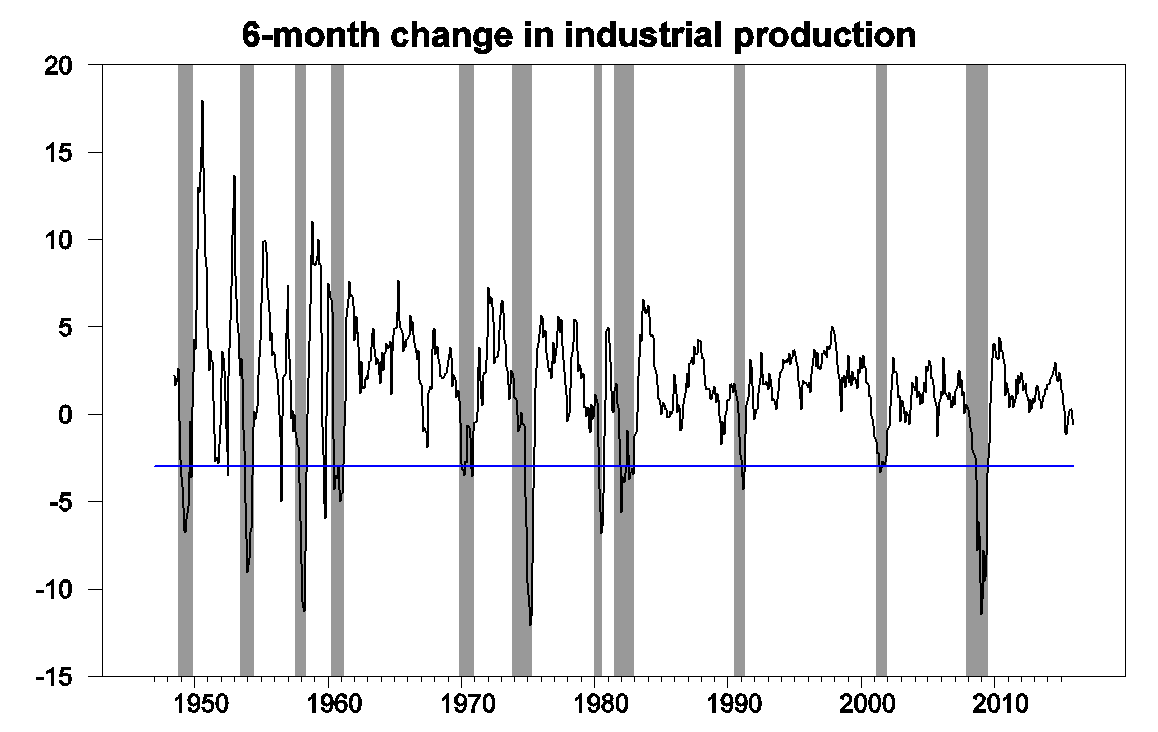
100 times the 6-month change in natural log of index of industrial production, from FRED, with NBER recessions as shaded regions and blue line at -3.0 threshold.
Though I am concerned that even the 12-month change in industrial production is down.

100 times the 12-month change in natural log of index of industrial production, from FRED, with NBER recessions as shaded regions and blue line at 0.0 threshold.
Another indicator of weakness in the manufacturing sector is the ISM Purchasing Manager’s Index, currently at 48.2. Any value below 50 indicates that more responders are indicating declines rather than improvements in key measures. But an analysis of this indicator by Travis Berge and Oscar Jorda concluded that you’d want to see a value below 44.5 before calling it a recession.
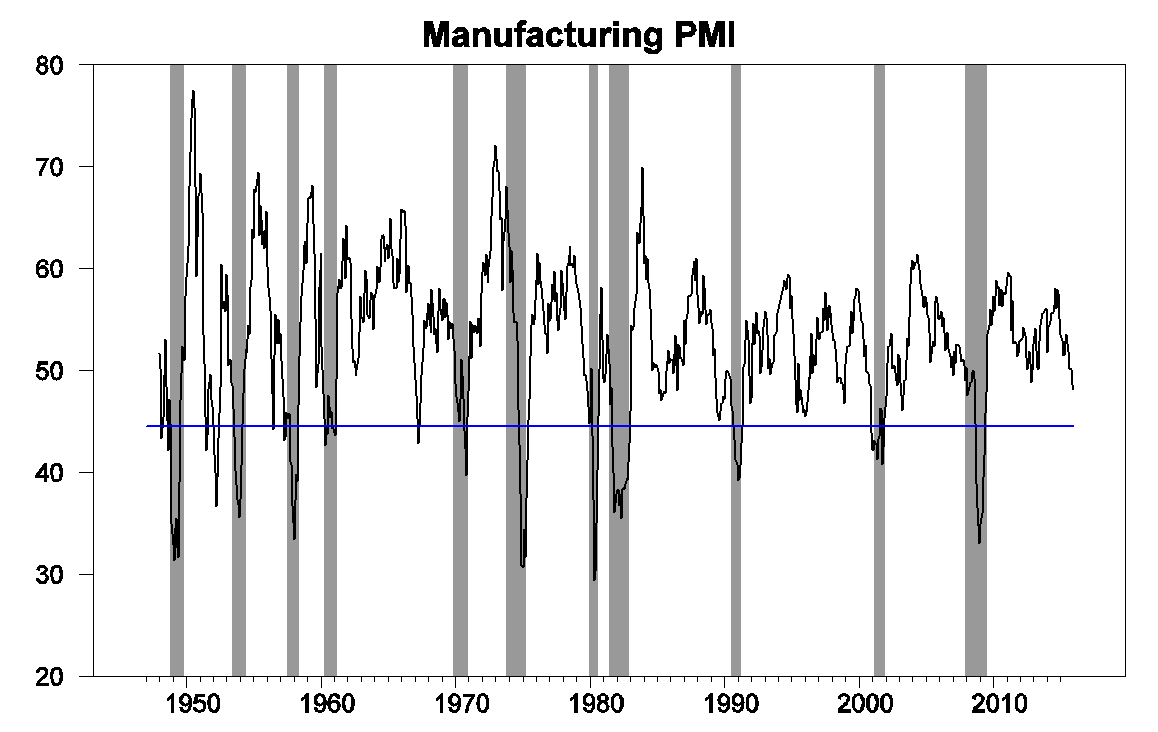
ISM Manufacturing PMI Composite Index, from FRED, with NBER recessions as shaded regions and blue line at 44.48 threshold.
And the non-manufacturing PMI is looking solid.
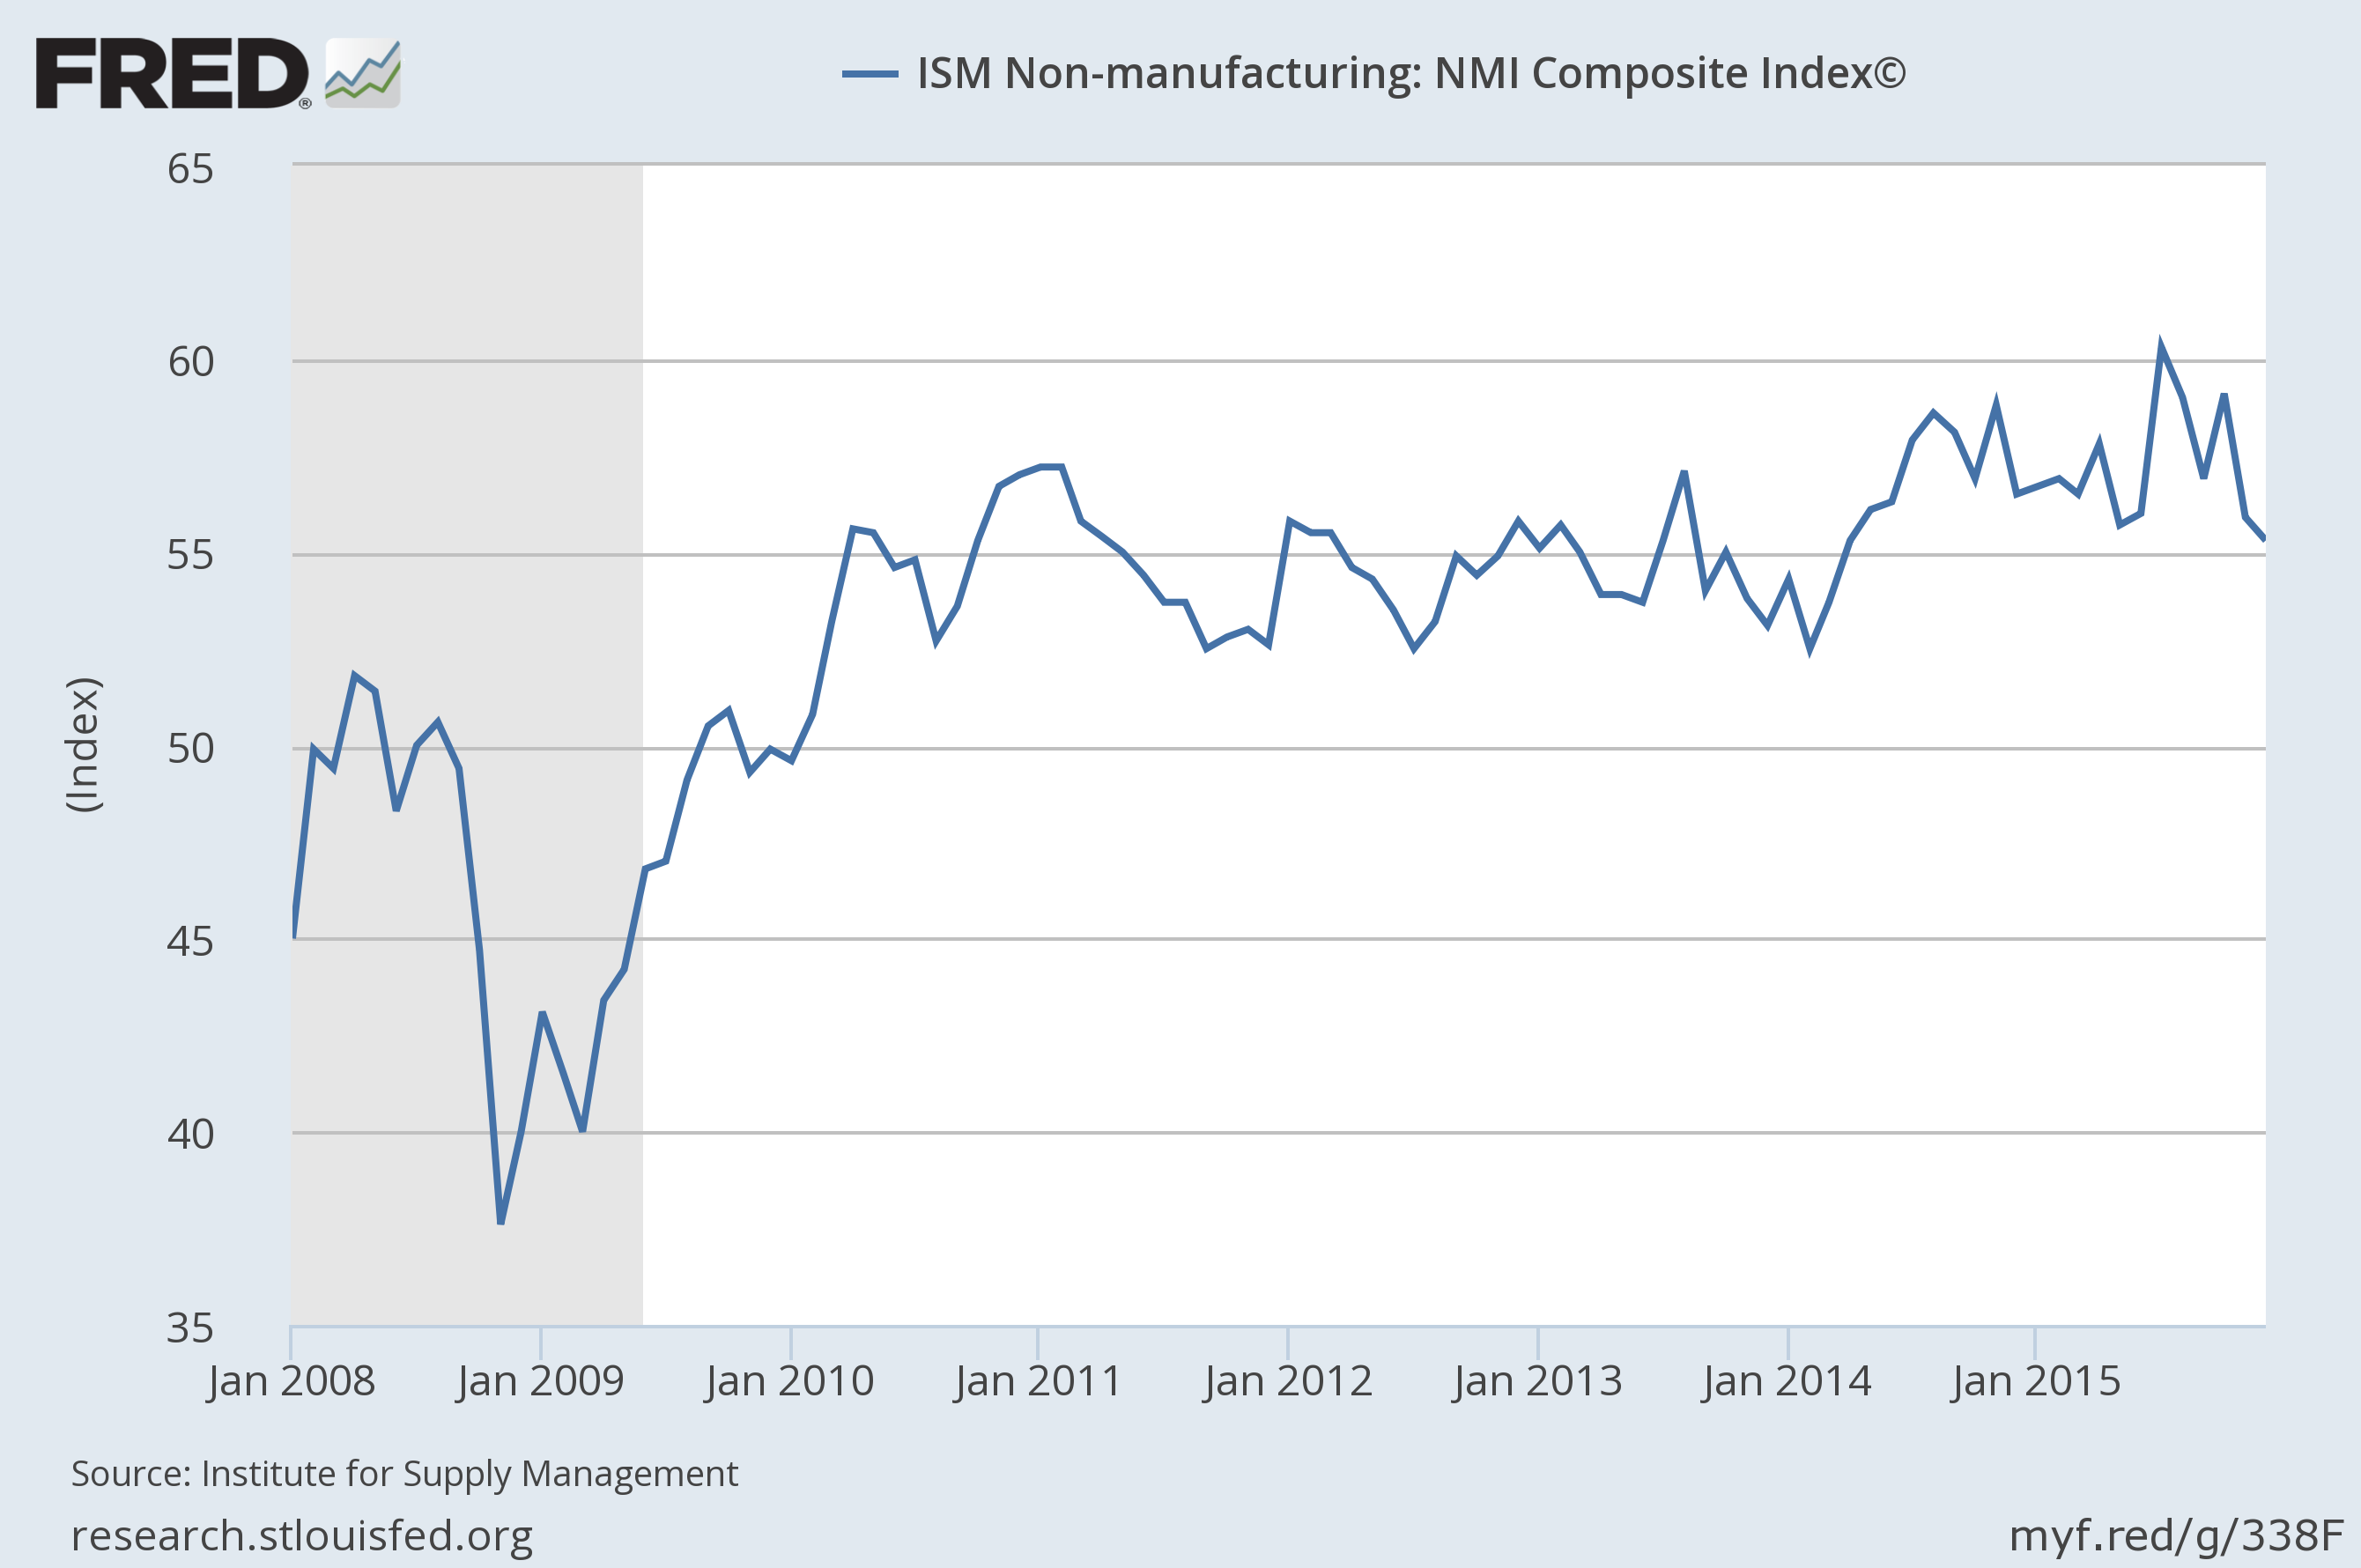
Source: FRED.
To summarize, the U.S. is unquestionably facing some headwinds from slow economic growth elsewhere in the world. But so far none of the indicators are consistent with the conclusion that we’ve already entered a recession.


