
by Reverse Engineer, Doomstead Diner
Discuss this article at the Energy Table inside the Diner
While all eyes are focused right now on the Oil Price Collapse, with it’s numerous implications as far as the Energy Industry, Bankstering and Transportation Industries are concerned, in the background and not well reported on or chronicled statistically is the ever widening problem of Electrical Grid Blackouts & Brownouts.

Even more than liquid fuels for transportation, Electricity DEFINES the Modern Industrial Culture, and is considered an “Essential Service“.
Living without electricity in today’s technological world may be difficult to imagine. Yet the reality of living without computers, mobile phones and entertainment systems, and managing a transport system thrown into chaos by an absence of traffic lights, trains and subways, may become increasingly common, according to an academic study published today.
New research by Hugh Byrd, Professor of Architecture at the University of Lincoln, UK, and Steve Matthewman, Associate Professor of Sociology at the University of Auckland, New Zealand, reveals that today’s occasional blackouts are dress rehearsals for the future, when they will occur with greater frequency and increased severity.
According to the study, power cuts will become more regular around the globe as electrical supply becomes increasingly vulnerable and demand for technology continues to grow at an unprecedented rate.
Professor Byrd said: “Electricity fuels our existence. It powers water purification, waste, food, transportation and communication systems. Modern social life is impossible to imagine without it, and whereas cities of the past relied on man-power, today we are almost completely reliant on a series of interlocking technical systems. Our research therefore explores what happens when the power goes off, and explains why the security of fuel supply is such a pressing social problem.”
Electrical power has been defined as a ‘critical infrastructure’ by the International Risk Governance Council, in that it is a ‘large-scale human-built system that supplies continual services central to society’s functioning’. However, electricity supply is less robust than commonly supposed.
You simply cannot run any modern city without copious amounts of Electricity, most often provided by Coal Plants around the world, but with dependence also on all the forms of Fossil Fuel and Nuclear, as well as Hydro and Wind Power in selected locations.Every one of these forms of Power generations faces issues now, and the grid which distributes the power also is deteriorating and keeping it repaired and functional after every weather related problem from Tornadoes to Ice Storms and just plain old T-Storms costs every community more money they just do not have every day.
Going back to 1989 in Mr. Peabody’s WAYBAC Machine, Richard Duncan developed a metric of PER CAPITA Energy, which is much more important than precisely how much Oil is coming out of the ground at any given point in time, although despite the Hype on Fracking, Oil Production globally has been FLATLINED for near a decade now, and the Fracked stuff just keeps us treading water, at an enormous price.
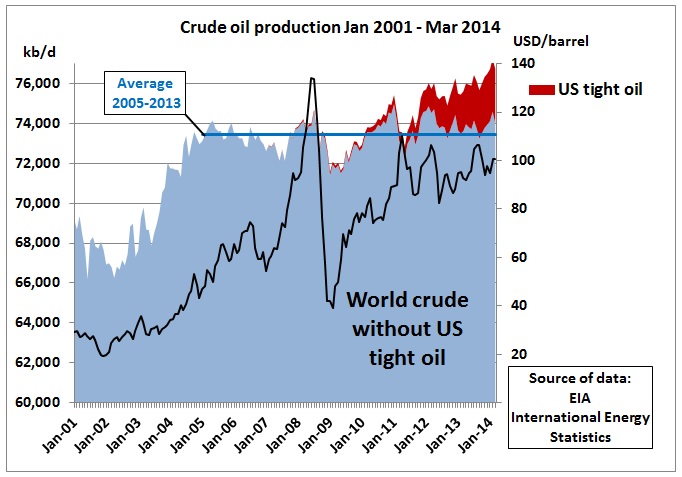
In the intervening time between January of 2005 and January of 2014 though, the Total Global Population of Homo Sapiens has increased by roughly 1 Billion People with a current total population somewhat in excess of 7 Billion, for a roughly 15% Population increase over the time period:

So, just to stay EVEN in Per Capita Energy Consumption, over this time period Energy Extraction would have needed to increase also by 15%, but obviously it has not. The amount of AVAILABLE per capita energy has been decreasing for quite some time, due mainly to Population Increase while the extraction rate for energy has remained more or less Flatlined for around a decade now.
At this point however, as credit becomes constricted to access energy in most places of the world (Ugo Bardi for instance noted that Italy has seen a 35% drop in Oil Consumption over the last decade), it’s not just Per Capita energy consumption that is on the downslide, but GROSS TOTAL CONSUMPTION as well.
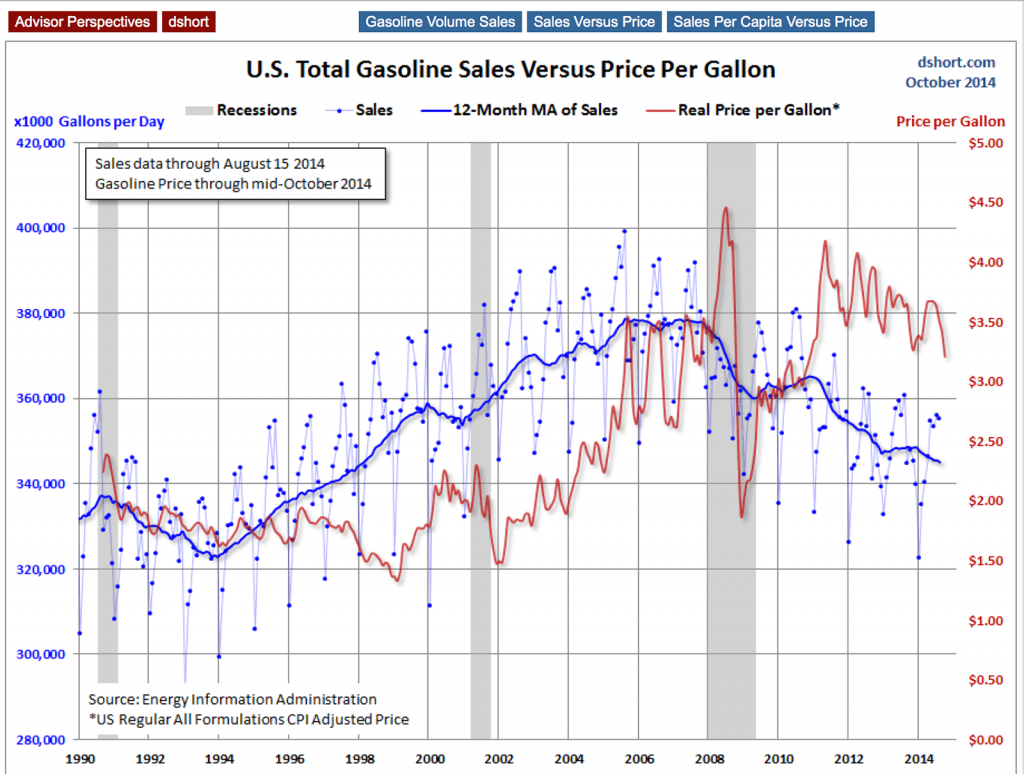
You can see this in this chart from Doug Short, which shows a 10% drop in Gasoline consumption here in the FSoA over the last 6 years since the end of the Consumption Peak in 2008
So, the Demand Destruction and decreasing consumption of Energy is pretty apparent by the numbers in the Liquid Fuels area, but what about in the even more critical area of Electricity, powering the Lights, the Sewage Treatment Plants, the Elevators and the Subway systems of the major cities that have exploded in population since the Age of Oil began?
Fortunately for us observers of Energy Resource Depletion & Dissipation, we have available the Suomi NPP Visible Infrared Radiometer Suite, which has made some marvelous images of the night time Earth, including the Black Marble Image.

Here’s the Flat Map of the Whole Globe, revealing clearly where industrialization has infected over the years:
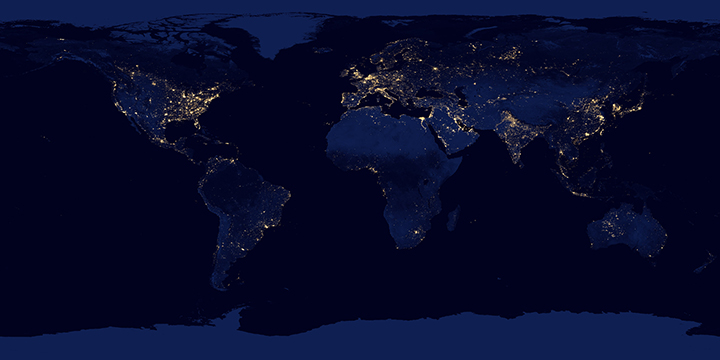
Remarkable how small a portion of the world really got Wired Up here before burning through the legacy of a few million years of fossil fuel collection
After doing a bit of Googling, I found these two images of North America, one from 2012, the other from 1995.

Now, these two images were captured with different equipment, but you can see unmistakeably how much the Great Plains area has diminished in overall lighting, with one notable exception, that VERY large and bright spot I circled in Yellow. What do you suppose that is?
That folks is the Bakken Oil Fields around Williston, ND. It’s partially increased electric lighting, but mostly NG Flaring. Here’s a Closeup View:


You can see the opposite effect if you look in the Southeast, increasing brightness down there where a lot of development took place through the period.
With the Suomi Instrument now up, detailed analysis of changing amounts of “light pollution” have been undertaken, most notably around Europe in this report published in January of 2014 in the Journal Nature:
Contrasting trends in light pollution across Europe based on satellite observed night time lights
The analysis is very thorough, and generates some very interesting data
We assessed changes in artificial lighting in terms of the extent of the areas decreasing and increasing in brightness over the region. The method was validated by the successful attribution of regions of both increasing and decreasing intensity in a calibration area in South-West England to urban and industrial developments, confirming that the observed direction and timing of change is consistent with known changes in nighttime light intensity on the ground. We then extended the approach to map areas of increasing and decreasing brightness across Europe. While the brightness of nighttime light pollution across Europe is increasing overall, clear regional differences exist, with considerable regions experiencing apparent net dimming over the period.
Here is the area around Southwest England used for calibration purposes. Blue areas are decreasing light intensity, Red areas increasing:

Highlighted regions: (a) Annual trend in brightness for areas associated with the china-clay (kaolin) industry, (blue line); total china clay production (black line). (b) Annual trend in brightness for the urban region of Torbay (blue); total power load on municipal street lighting in Torbay (black). (c) Annual trend in brightness for Wytch Farm onshore oil field (blue); total oil production from the field (black). Map generated using ESRI ArcMap 9.2.
For Europe as a whole, here’s the maps and analysis:

(a) Intercalibrated mean brightness for Europe 2005–2010. (b) 10-year change in brightness, calculated as the difference in mean values for the periods 2005–2010 and 1995–2000. Grey areas are saturated throughout the time period, so trends cannot be detected. (c) Proportions of the total land surface area for which artificial light was detected to increase (orange) and decrease (blue) by more than 3 DN units in constituent countries of Europe. *Data south of 65 degrees latitude only. Map generated using ESRI ArcMap 9.2.
Changes in European light pollution
In common with recent studies in Asia13, 16, 24, Europe has experienced a marked net increase in nighttime light pollution since satellite images first became available (Figure 2). Inferences about heavily urbanised areas must be treated with caution as the DMSP/OLS sensors saturate at high light levels; however, marked regional differences within the unsaturated rural and suburban areas exist. It has been previously noted that large areas of some countries of the former Soviet Union, such as Moldova and Ukraine, experienced a contraction in lighting following independence22; the effects of this change are still evident in this study over a more extended time period. Widespread decreases in brightness also occur in Hungary and Slovakia. Moreover, we find that several economically developed countries, including Sweden, Finland, Denmark, Norway, the United Kingdom, Belgium and Northern Germany also show areas apparently experiencing detectable localised declines in brightness.
The changes here aren’t uniform, and while some are predictable based on the current economic situation, some others are counter-intuitive. Here’s a Geographical breakdown of a few selected locations:

(a) Belgium shows decreases in nighttime brightness along the motorway network, while neighbouring regions of France have increased substantially in brightness. (b) Slovakia shows marked decreases in brightness, with the exception of Bratslava and towns in the west of the country. In contrast, neighbouring regions of Poland have become substantially brighter. Map generated using ESRI ArcMap 9.2.
As you might have expected if you follow collapse dynamics, countries formerly in the orbit of the Former Soviet Union (FSU), which did not glom onto the Western economy after the fall like Slovakia see a marked Dimming of the Bulbs, whereas countries like Poland got Brighter Bulbs in the aftermath of that collapse. Southern European Nations which saw a lot of investment over the time period got brighter, whereas aging industrial countries like Belgium and the Netherlands have grown dimmer.
Moving around the globe to the East, you can see the close relationship between power consumption and GDP by looking at the graph of Power Output versus GDP for the period from 1998 through 2012:

What can we expect moving forward here into the future?
Well, far as China is concerned, those numbers are going to continue to slide, and in all probability you are going to see the Bulbs go Dimmer in China over the next couple of years. Even more than China, India is likely to see total lumens decreasing rapidly as time passes.
Unlike the numbers dished out by the Chinese Politburo or Da Fed and the BLS here which can be easily massaged to make it appear as though there is “Growth” where there is no real growth, the image data generated from the Suomi Satellite is harder to disguise, though of course not impossible either since both NASA and NOAA are Goobermint agencies. At the moment however, there are probably too many scientists with access to the real time data streams to falsify the imagery, and too few people who recognize what is going on for it to matter on a political level if the Globe clearly shows a progressive and increasing Dimming effect.
If you are aware of these things though, this provides one of the BEST METRICS around to observe the collapse of Industrial Civilization. At the moment I am unable to locate a way to access regular updated satellite imagery on this for the typical web surfer, however I am hopeful that my good friend Ugo Bardi, Professor of Physical Chemistry at the University of Firenza may have better luck through the university system.

Besides watching and cateloging as cities like Detroit and Hoboken grow dimmer, another fascinating Bright Spot to watch over the next year is that Bonfire going on in the Bakken right now, which one of my friends in the industry who flies in there regularly says is simply amazing to see from the air. With an already 40% decrease in Drilling permits being applied for as the price of Oil drops here, it seems likely that this particular Bright Light will be a lot Dimmer next year, and dimmer still the year after that.
How LONG will it take for the Planet to go COMPLETELY Dark at night? Probably a relatively long time, but at the same time there will probably be occassions where large regions go dark simultaneously and other occassions where the overall lumens decrease rapidly in a given location as many of the lights are extinguished. A simple example would be a struggling municipality cutting off half its Streetlights in order to save on the Electric Bill. Or a Suburb with a lot of foreclosures having a greater number of Dark McMansions.
The Comparison Photo I put up of North America 1998 vs 2012 probably gives the best indication of how the loss of electric power will go, first disappearing from Low Population Zones and gradually spreading toward the densely populated areas. It looks as though California is getting close to being Sunffed Out going West from Bakken, and moving Eastward the Mississipi River Population Zone will see more Dimming. This correlates well with the ongoing Geopolitical problems in places like Ferguson, a suburb of St. Louis, and of course rust belt cities like Detroit and Gary, Indiana.
In the Final Countdown, probably only a few Major Metros of First World cities like NY Shity, London, Berlin etc will still have so many lights on they resemble Diodes on a circuit board. How LONG will this process take though? Absolute Light Intensity Dimming in North America over the last 15 years is discernable, but it hasn’t totally stopped BAU in the FSoA. If the regression is a linear function, in another 15 years things would be worse, but not altogether different.
Thing is, this is probably not a linear function, as suggested by Ugo Bardi’s Seneca Cliff.
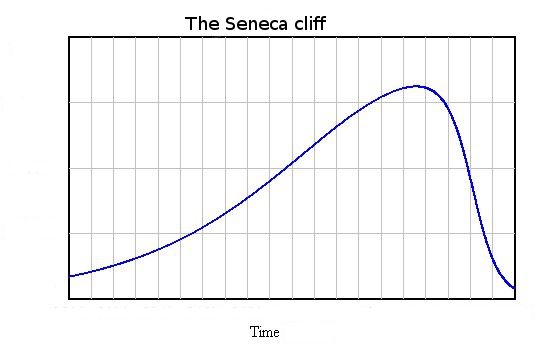
Once the dropoff begins, it tends to accelerate with many positive feedback loops involved. So in all likelihood we will see acceleration of this phenomenon around the globe over the next 15 years, and a significant portion of the currently Lit Up portions of the Black Marble will have gone dark by then.
Here in the FSoA, probably the most significant one to watch over the next couple of years is the Hoover Dam. As of Novemeber 2014, the water level is at 1083 feet. Here’s the last few years of records for Lake Mead:

Hoover reaches the “Dead Pool” level at 950 feet, still 130 feet away, but relief from the drought affecting the Colorado River watershed is nowhere in sight at the moment.

“The level of Lake Mead is supposed to drop to an elevation of 1081.75 over the next few days, which is the lowest elevation it’s ever been since the lake was filled when Hoover Dam was built,” said Rose Davis, Bureau of Reclamation.
Lake Mead is not only the primary water source for Las Vegas, but it’s also how Hoover Dam produces power. Simply put, the lower the lake, the less electricity.
“Our concern is the ability to generate power. We’ve seen a 23 percent reduction in our capacity to generate power since the lake continues to drop,” Davis said.
The hydroelectric facility is taking steps so its current capacity of 1592 megawatts won’t go down anymore.
“We’ve been proactive over the last five years in putting in new equipment that operates more efficiently at low lake levels,” Davis said.
Three wide head turbines have been installed, and two more are on the way in the next couple years. It’s hoped they will arrive before Lake Mead gets to catastrophic levels that could bring the dam to screeching halt.
“What we call the dead pool, which is the elevation of Lake Mead where Hoover Dam cannot generate any power is about 950 feet,” Davis said.
Even without complete shutdown at Hoover, a 23% Reduction in power output is already hugely significant. Referencing back to the close connection between GDP and Electric Power however, such a large reduction in Power Output means a similarly large reduction in GDP for the neighborhoods served by Hoover, which are vast going from Vegas to Phoenix to Los Angeles. To replace that power they have to BUY fossil fuel power off the grid, every Kilowatt Hour Hoover does not produce is more money out of the ever more insolvent coffers of everyone living in this neighborhood.
However, until Hoover shuts down completely, these issues mostly are not recognized, neither by the typical J6P nor the MSM reporting on it and not even by most Economistas. They don’t tie the ever decreasing Standard of Living to the Falling Water Level in Lake Mead. These are disparate phenomena to them. In fact your Standard of Living is ALL about how much Power you consume, and the higher the power consumption, the higher your ‘Standard of Living”, at least by the common metrics of the Industrial Era such as GDP. The less access you have to energy, either Electricity or Gasoline to power your car, the lower your Standard of Living will be, eventually achieving 3rd World levels where the vast majority of the population has access to neither one.
How fast this will actually spin down still remains an open question, but now we do have Metrics by which to observe it, and to document that in fact there IS a Collapse in Progress, which most of the population remains in Denial about. The end result is quite clear, it is the End of Industrial Civilization, and this is the FINAL COUNTDOWN.


