Written by Steven Hansen
I wish I had the answer to correct the wealth imbalance between the average Joe and the ultra-rich. Personally I see no evidence that taxing the crap out of the rich to gift the poor will do anything to correct the imbalance.

The rich have the wherewithal to avoid, recoup, reorganize …. any solution to create better economic balance must provide profitable avenues for the poor to gain ground – not sock it to the rich who have the resources to defeat taxation and regulation. This is part of trickle up schemes which are as ineffective as trickle down. This week we were reminded again of the power of the rich with the ongoing release of the Panama Papers. From the National Observer:
The numbers are staggering. The OECD claims that offshore banks globally hide some (US) $5-trillion to (US) $7-trillion from tax authorities, or up to 8% of the world’s assets under management. Moreover, an estimated (US) $11.5-trillion is being stashed in offshore accounts worldwide for one reason or another.
How does one know there is an imbalance? – it is the difference between the average and median income and wealth. As a reminder:
- The median of a set of numbers is that number where half the numbers are lower and half the numbers are higher; and
- The average of a set of numbers is the total of those numbers divided by the number of items in that set.
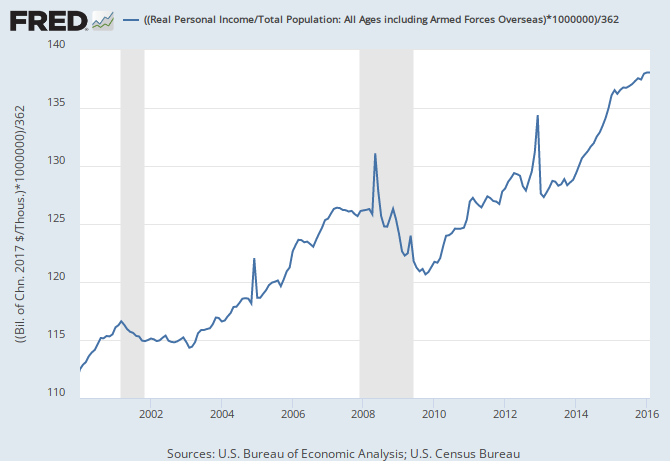
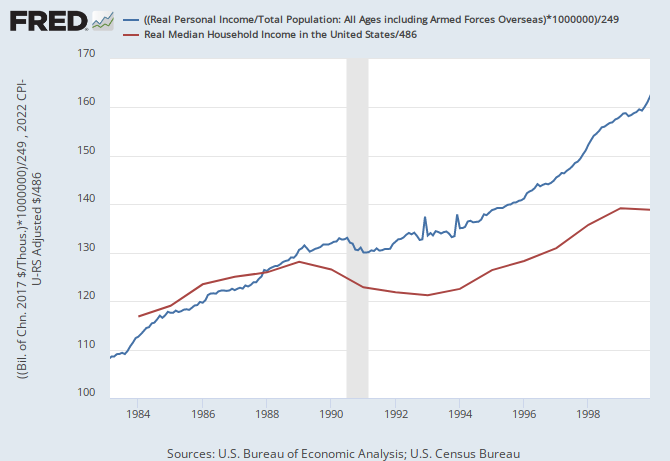
Generally speaking, if the average and the mean are close to each other, there is balance. In the case of personal income, proof of the imbalance is easy to visualize. The average disposable personal income per capita is up over 22% since 2000.
While median household income is still slightly negative (down 0.3% since 2000).

According to my back-of-an-envelope calculations, it seems that there was roughly a 20% growth differential between median and average income in the previous 20 year period.
It is hard to be exact as median income data sets are based on household income whilst average income data sets are per capita. I find it interesting that the government is doing little to help track economic balance – simply the data is not being collected to facilitate accurate analysis.
Nowhere is income disparity more obvious than looking at net worth from a 2014 Credit Suisse survey [hat tip to Financial Samuri].

There were always very rich people, while the masses were generally poor. There are limits to the data that make it difficult to say that the imbalance is getting worse or better. Being a conspiracist, I always consider if manipulation by the powers could suppress data which could illuminate. There are many issues for which I would like hard data – and in today’s information age it would be relatively easy to accumulate. Instead the USA uses the information age to monitor communications instead of creating monetary flows data bases which would help track the economy – and give immediate and accurate feedback.
Because it is relatively easy to track economic inequality if the data was accumulated, I can only assume the divide between the rich and poor is getting worse (based on my conspiracy theory biases).
Other Economic News this Week:
The Econintersect Economic Index for April 2016 again insignificantly improved but remains relatively weak. The index continues near one of the lowest values since the end of the Great Recession. This marginal index improvement is due to data being compared against relatively soft data – both month-over-month and year-over-year. Our employment six month forecast is for slightly weaker employment growth for April – and the long term decline in the employment forecast remains in play.
Current ECRI WLI Growth Index

The market expectations (from Bloomberg) were 261,000 to 290,000 (consensus 272,000), and the Department of Labor reported 267,000 new claims. The more important (because of the volatility in the weekly reported claims and seasonality errors in adjusting the data) 4 week moving average moved from 263,250 (reported last week as 263,250) to 266,750. The rolling averages generally have been equal to or under 300,000 since August 2014.
Weekly Initial Unemployment Claims – 4 Week Average – Seasonally Adjusted – 2011 (red line), 2012 (green line), 2013 (blue line), 2014 (orange line), 2015 (violet line)

Bankruptcies this Week: PostRock Energy, Pacific Sunwear of California (aka PacSun), Bejing, China-based Winsway Enterprises Holdings Limited (f/k/a Winsway Coking Coal Holdings Limited – Chapter 15)


