Written by Steven Hansen
Whenever I think that consumer credit growth must be nearing the tipping point, the next month consumer credit grows again. After all, logic dictates the more debt grows the harder it becomes to repay the debt and still be able to buy necessities.

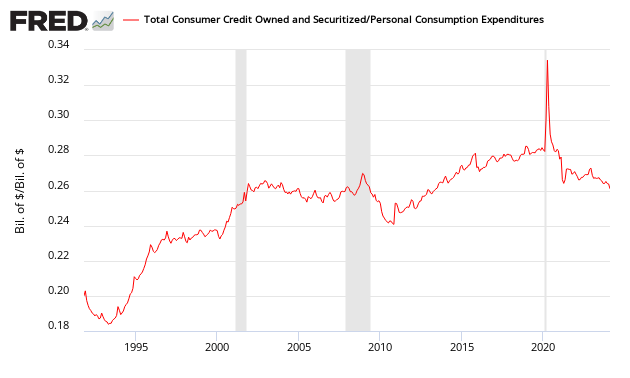
The graph below shows the ratio of consumer credit outstanding to personal consumption expenditures (this data series does not include mortgages) is now above a the pre-Great Recession high, and well above the averages before the mid 1990s.
Ratio of Total Consumer Loans Outstanding to Consumer Spending
The reality is that consumer loans bear less interest in the New Normal than they have historically. The percent of consumer disposable income used to repay consumer loans (not including mortgages) is shown on the below graph. Currently the amount of income needed to repay debt seems below average for periods of economic expansion.
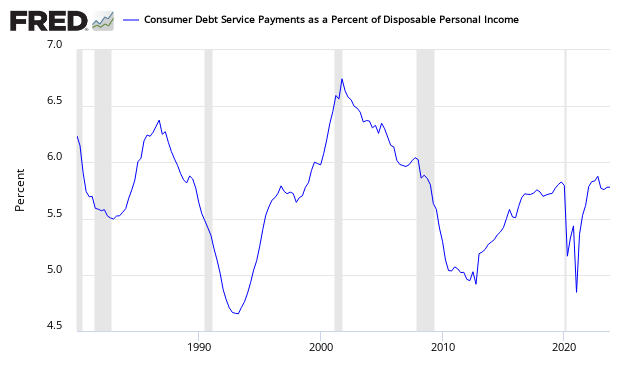
Still, the income needed to repay debt is increasing – and what happens if the Federal Reserve gets its wish that inflation should pick up?
To get a feel of inflation adjusted consumer credit, the following graph is inflation adjusted consumer credit using the CPI-U (less shelter) – this is expressing consumer credit in 1982 dollars. It is evident on an inflation adjusted basis, consumer credit is growing at a fairly good clip.
Inflation Adjusted Consumer Credit

Also, an interesting graphic showing the consumer’s ratio of liquid assets to total liabilities is showing an improvement in liquidity when compared to liabilities. But consider that this ratio is well below periods of rapid expansion.
Ratio of Consumer Liquid Assets to Total Consumer Liabilities

The only indicator that consumer credit is in a “normal” range is the percent of consumer disposable income used to repay consumer loans. This indicator will evaporate in seconds if the Fed gets its wish to have inflation pick up.
I believe the Federal Reserve’s little game of maintaining artificially low interest rates and other abnormal monetary games will come home to roost. If inflation picks up – there is an immediate consumer credit bubble triggered from revolving credit. If the Fed’s games put the USA in a deflationary spiral, the USA will still have a consumer credit bubble resulting from the principal being harder to repay. The only hope for consumer debt may be that the economy keeps stumbling along.
Other Economic News this Week:
The Econintersect Economic Index for April 2016 again insignificantly improved but remains relatively weak. The index continues near one of the lowest values since the end of the Great Recession. This marginal index improvement is due to data being compared against relatively soft data – both month-over-month and year-over-year. Our employment six month forecast is for slightly weaker employment growth for April – and the long term decline in the employment forecast remains in play.
Current ECRI WLI Growth Index

The market expectations (from Bloomberg) were 253,000 to 280,000 (consensus 267,000), and the Department of Labor reported 253,000 new claims. The more important (because of the volatility in the weekly reported claims and seasonality errors in adjusting the data) 4 week moving average moved from 266,500 (reported last week as 266,750) to 265,000. The rolling averages generally have been equal to or under 300,000 since August 2014.
Weekly Initial Unemployment Claims – 4 Week Average – Seasonally Adjusted – 2011 (red line), 2012 (green line), 2013 (blue line), 2014 (orange line), 2015 (violet line)

Bankruptcies this Week: Peabody Energy, Energy XXI


