from Voxeu.org
— this post authored by Stefania Albanesi, Giacomo De Giorgi and Jaromir Nosal
The Global Crisis narrative has suggested that an expansion of subprime credit was the reason for rising mortgage defaults, leading to the large-scale recession in 2007-09. Taking a closer look at the characteristics of subprime credit holders over the period, this column argues that the growth in mortgage defaults did not occur predominantly amongst subprime credit holders. Instead, it was real estate investors that played a critical role in the rise in mortgage debt, specifically among the middle and the top of the credit score distribution.

Please share this article – Go to very top of page, right hand side, for social media buttons.
Understanding the fundamental factors behind the boom and bust in credit has been a hotly debated topic in academic and policy circles. A popular narrative, based on the findings in Mian and Sufi (2009), suggests that most of the growth in credit during the 2001-2006 boom was concentrated in subprime zip codes, even though income did not rise over the same period for these areas. According to that narrative, the expansion of subprime credit then led to a rise in mortgage delinquencies and foreclosures, which caused the housing crisis and the subsequent 2007-2009 recession (Mian and Sufi 2010, 2011, Mian et al. 2013, 2015). That popular narrative has been challenged more recently by Ferreira and Gyourko (2015), who argue that debt growth was similar for prime and subprime borrowers, Adelino et al. (2016), who emphasise the role of the “middle class”, as well as Foote et al. (2017), who point out that credit did not shift towards lower income individuals or locations in the run-up to the crisis.
An alternative narrative
In a new paper, we also examine the evolution of mortgage debt and defaults during the credit boom and throughout the financial crisis and its aftermath, using individual-level data from the Federal Reserve Bank of New York Consumer Credit Panel (Albanesi et al. 2017). These administrative data contain the full history of borrowing and defaults for a nationally representative panel of borrowers, as well as their credit score and demographic information, allowing us to provide a comprehensive assessment of their behaviour. Our findings suggest an alternative narrative, which challenges the view that an expansion of the supply of mortgage credit to subprime borrowers played a large role in the credit boom in 2001-06 and the subsequent financial crisis. Specifically, we show that credit growth during the boom was concentrated in the middle and at the top of the credit score distribution. Borrowing by individuals with low credit scores was virtually constant during this period. We also find that the rise in defaults during the 2007-09 crisis was concentrated in the middle of the credit score distribution. While borrowers with low credit scores typically had higher default rates than those with higher credit scores, default rates for borrowers with higher credit scores rose substantially during the financial crisis. As a result, the fraction of foreclosures accounted for by the highest three quartiles of the credit score distribution rose from 35% to 70%. Our analysis points to a large role of real estate investors – mortgagors who held multiple first liens – in both the boom and bust of the housing market. We find that investors were responsible for most of the growth in balances and virtually all of the rise in defaults for prime borrowers.
Our results then offer new perspectives for policies aimed at preventing or remediating turmoil in the mortgage and housing markets. First, increasing restrictions on loans to subprime borrowers may be misguided, as these borrowers contributed to the boom-bust in credit only marginally. Second, real estate investors are the major driver of aggregate mortgage balances and defaults, suggesting that owner-occupied housing is less sensitive to movements in real estate values. Our findings point to the role of this segment being critical for future policy and research.
Individual-level evidence
A critical factor in any explanation of the credit boom and the financial crisis is the distribution of debt and defaults by credit score. The credit score is the principal summary measure of individual default risk in US household credit markets, as it summarises a borrower’s past history of debt and defaults. We argue that a relatively recent credit score should be used to assess default risk at the time of borrowing. We show that recent credit scores are tightly related to labour income, which is obviously important determining whether a borrower will be able to make payments on newly contracted debt. Additionally, recent credit scores incorporate more information on the borrower’s past performance. Previous credit score-based analyses used initial, i.e. pre-boom, credit scores. We show that this approach mainly captures life cycle credit demand for borrowers who have low credit scores at the beginning of the sample, because low credit score borrowers are predominantly young. Young borrowers exhibit steep growth in income and debt in subsequent years, and their credit score also rises rapidly as they build their credit history. Figure 1 reports the age distribution of borrowers by credit score quartiles and Figure 2 plots the evolution of credit scores over time of individuals based on their initial credit score. Low credit score borrowers are much younger than those with higher credit scores. Additionally, borrowers in the first quartile of the credit score distribution at the beginning of the sample, who are all subprime, exhibit the most rapid subsequent credit score growth.
Figure 1 Age distribution by 1999 risk score quartile

Source: Authors’ calculations based on the FRBNY CCP/Equifax Data.
Figure 2 Ratio of current to 2001Q1 credit score by 1999 credit score quartile

Source: Authors’ calculations based on the FRBNY CCP/Equifax Data.
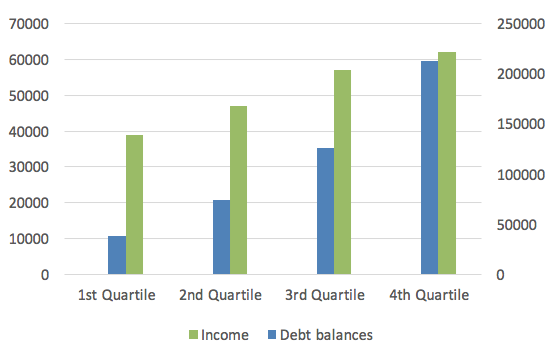
In Figure 3, we present the 2009 debt and income levels of individuals who are in the lowest credit score quartile at the beginning of the sample. Those whose credit score remains low end up with low income and debt, whereas those whose credit scores improve end up with significantly higher debt and income. These results imply that initial credit rankings are not a good proxy for default risk at later dates.
Figure 3 2009 labour income (left axis) and debt balances (right axis) by 2009 credit score quartile for individuals in quartile 1 of 1999 credit score distribution
Source: Authors’ calculations based on the FRBNY CCP/Equifax Data.
Figure 4 quantifies the role of life cycle factors in the behaviour of debt growth by initial credit score. The top panel plots mortgage balance growth relative to 2001Q3 by initial credit score quartile. Consistent with prior studies, low initial credit score individuals exhibit the highest subsequent growth in mortgage balances. The bottom panel reports the same growth in balances with life cycle effects removed, which is virtually identical across quartiles. These results suggest that the differences in debt growth by initial credit score emphasised in prior research are mainly driven by life cycle demand for credit.
Figure 4 Real mortgage balances by 1999 Equifax Risk Score quartile, actual and counterfactual
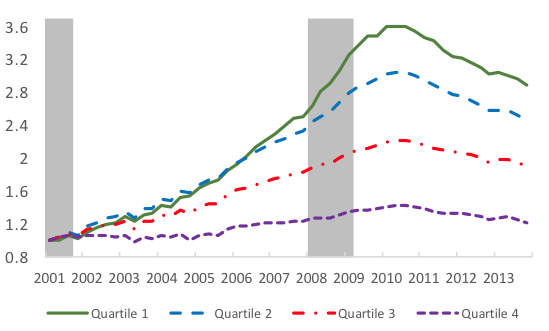

Note: Ratio to 2001Q3. Counterfactual assigns to each 1999 age bin, in each quarter, debt balances of those who currently are in that age bin.
Source: Authors’ calculations based on the FRBNY CCP/Equifax Data.
Evidence at the zip code level
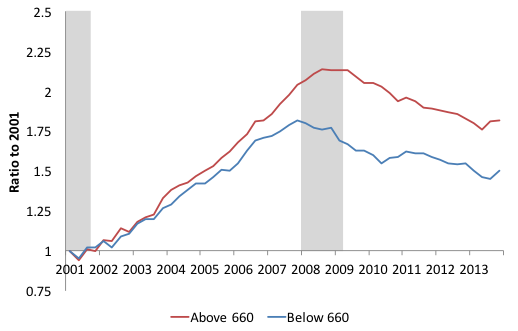
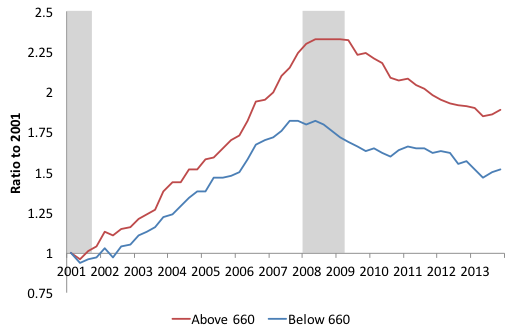
We also examine the behaviour of debt and defaults at an aggregated zip code level in order to relate our findings to prior studies that use geographically aggregated data. Because we also have access to individual data, our analysis can provide important insights into the relation between individual and geographically aggregated outcomes, shedding light on the mechanism through which credit growth affects other economic variables. We sort zip codes into quartiles based on the fraction of subprime individuals (those with credit score below 660) living in a zip code. Figure 5 illustrates the growth of mortgage credit in each of the zip code quartiles. Quartile 4 (with the highest fraction of subprime borrowers) zip codes exhibit the highest mortgage credit growth, consistent with prior studies (Mian and Sufi 2009). However, using individual-level data underlying those aggregates reveals that the most rapid growth in mortgage balances was among prime borrowers living in those zip codes. This is true for all zip code quartiles. This suggests that the fraction of subprime individuals captures variation across zip codes that is not necessarily related to the behaviour of prime or subprime borrowers specifically.
Figure 5 Zip code-level per capita mortgage debt-growth for prime (red) and subprime (blue) borrowers by quartile of share of subprime in 2001
A. Quartile 1
B. Quartile 2
C. Quartile 3
D. Quartile 4
Note: ‘prime’ indicates an Equifax risk score above 660, and ‘subprime’ indicates Equifax risk score below 660. Based on 8 quarter lagged individual credit scores.
Source: Authors’ calculations based on the FRBNY CCP/Equifax Data.
To shed some light on why both prime and subprime borrowers in Quartile 4 zip codes experienced higher credit growth than those in lower quartiles, we explore other demographic and economic factors that could explain the variation in borrowing behaviour across zip codes with different fractions of subprime borrowers.
Figure 6 shows that the zip codes with the largest subprime population are much younger than the other zip codes. This is not surprising, given our findings with individual data. Based on our calculations, the difference in the age distribution alone can account for 84% of the difference in mortgage balance growth between Quartile 1 and Quartile 4 (44% and 43% for Quartiles 2 and 3 respectively). Moreover, low-education borrowers and minorities are also over represented in zip codes with relatively large subprime populations. The positive correlation between the concentration of subprime borrowers and the severity of the 2007-09 recession found in previous research may be driven by the high prevalence of these business cycle-sensitive populations in those zip codes.
Figure 6 The age distribution of ZIP-code quartiles based on the fraction of sub-prime population

Note: Sub-prime indicates below score 660
Source: Authors’ calculations based on the FRBNY CCP/Equifax Data.
The role of mortgage investors
Our finding that borrowers in the middle and at the top of the credit score distribution disproportionally default during the crisis is somewhat puzzling, as these borrowers historically exhibited very low default rates on any type of debt, as well as very low foreclosure rates. To gain insight on the driving force behind defaults by borrowers with relatively high credit scores, we explore the role of real estate investors. Using our data, we identify real estate investors as borrowers who hold two or more first mortgages, following Haughwout et al. (2011). There are four main reasons that may lead real estate investors to display higher default rates than other borrowers with similar credit scores.
- First, mortgages contracted for investment purposes typically carry a premium over mortgages for primary residences.
- Second, if investors are motivated by the prospect of capital gains, they have an incentive to maximise leverage, as this strategy increases the potential gains from holding a property, while the potential losses are limited, especially in states in which foreclosure is non-recourse.
- Third, only the primary residence is protected in personal bankruptcy, via the homestead exemption (Li 2009). Thus, a financially distressed borrower could potentially file for Chapter 7 bankruptcy and discharge unsecured debt using non-exempt assets to avoid missing payments on the mortgage for their primary residence.
- Finally, the financial and psychological costs of default for mortgage borrowers who reside in the home are typically quite substantial, as the resulting relocation would generate moving and storage costs, and possibly cause difficulties for household members in reaching their workplace or their school.
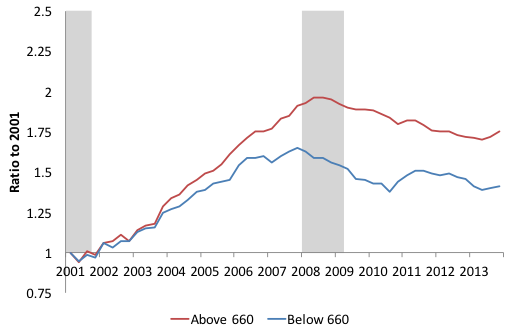
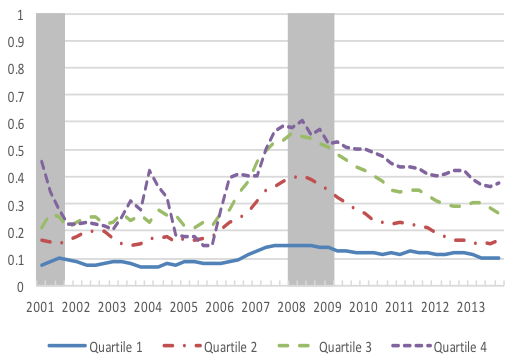
We find that real estate investors play a critical role in the rise in mortgage debt specifically for the middle and the top of the credit score distribution. The fraction of borrowers with two or more first mortgages rises from about 10% in 2004 to over 15% by the end of 2007 for the top three quartiles, whereas it is quite stable for the bottom quartile (Figure 7). Over the same period, the share of mortgage balances held by investors rises from 20%-25% to approximately 35% for the top three quartiles whereas the bottom quartile experiences only a 5% rise from a much lower level.
Figure 7 Fraction of borrowers with (top panel) and share of mortgage balances held by borrowers with (bottom panel) two or more first mortgages by quartile, of the 8-quarter lagged Equifax Risk Score

Source: Authors’ calculations based on the FRBNY CCP/Equifax Data.
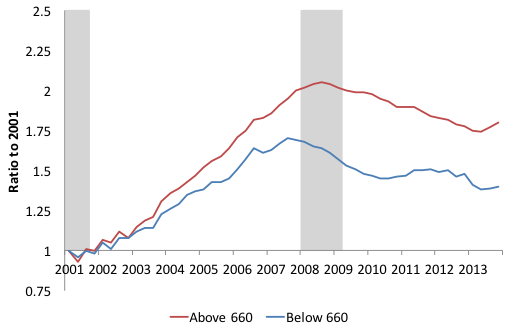
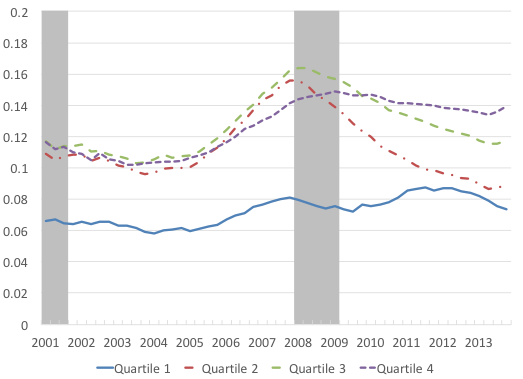
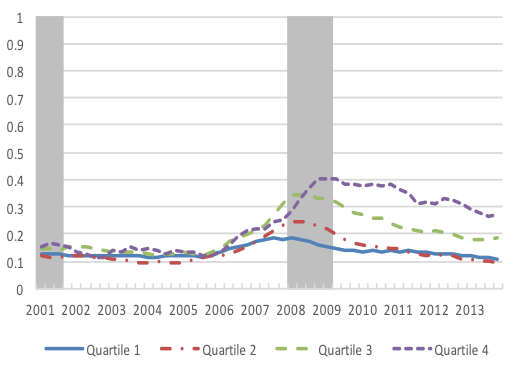
More importantly, we also find that the rise in defaults is mostly driven by real estate investors. Figure 8 plots the share of new delinquencies and foreclosures accounted for by real estate investors.
Figure 8 Investor share of 90+ days delinquencies (top panel) and foreclosures (bottom panel) by quartile, of the 8-quarter lagged Equifax Risk Score
Source: Authors’ calculations based on the FRBNY CCP/Equifax Data.
The investor share of new delinquencies was close to 15% for all credit score quartiles throughout the credit boom and increases to 25%, 35% and 40% between 2006 and 2009 for credit score quartiles 2-4, respectively. The rise in the investor share of foreclosures is even more dramatic.
In zip codes with a high fraction of subprime borrowers, the share of mortgage balances held by prime investors rises more than in those with smaller subprime populations, and so does their share of defaults. This pattern may explain the larger swing in housing values experienced by these zip codes.
References
- Adelino, M, A Schoar, and F Severino (2015), “Loan Originations and Defaults in the Mortgage Crisis: The Role of the Middle Class”, NBER Working Paper 20848.
- Adelino, M, A Schoar, and F Severino (2017), “Dynamics of Housing Debt in the Recent Boom and Great Recession”, NBER Working Paper 23502.
- Albanesi, S, G De Giorgi, and J Nosal (2017), “Credit Growth and the Financial Crisis: A New Narrative”, NBER Working Paper 23740.
- Foote, C L, L Loewenstein, and P S Willen (2016), “Cross-sectional patterns of mortgage debt during the housing boom: evidence and implications”, NBER Technical Report 22985.
- Haughwout, A, D Lee, J S Tracy, and W Van der Klaauw (2011), “Real estate investors, the leverage cycle, and the housing market crisis”, Federal Reserve Bank of New York Staff Reports, no. 514.
- Li, W (2009), “Residential housing and personal bankruptcy”, Business Review 2, 19-29.
- Mian, A, K Rao, and A Sufi (2013), “Household Balance Sheets, Consumption,and the Economic Slump”, The Quarterly Journal of Economics, 128 (4), 1687-1726.
- Mian, A, and A Sufi (2009), “The Consequences of Mortgage Credit Expansion: Evidence from the US Mortgage Default Crisis”, The Quarterly Journal of Economics, 124 (4), 1449-1496.
- Mian, A, and A Sufi (2010), “The Great Recession: Lessons from Microeconomic Data”, The American Economic Review, 100 (2), 51-56.
- Mian, A, and A Sufi (2011), “House Prices, Home Equity-Based Borrowing, and the US Household Leverage Crisis”, The American Economic Review, 101 (5), 2132-2156.
- Mian, A, and A Sufi (2014), “What explains the 2007-2009 drop in employment?”, Econometrica, 82 (6), 2197-2223.
- Mian, A, A Sufi, and F Trebbi (2015), “Foreclosures, house prices, and the real economy”, The Journal of Finance, 70 (6), 2587-2634.
- Mian, A R, and A Sufi (2016), “Household debt and defaults from 2000 to 2010: The credit supply view”, manuscript.
About The Authors
 Stefania Albanesi is Professor of Economics at the University of Pittsburgh, an NBER Research Associate and a CEPR Research Fellow. She is a macroeconomist whose research interests include the determinants and implications of various dimensions of inequality and the distributional implications of government policies. Prior to her appointment to the University of Pittsburgh, she was a professor at Duke University, Columbia University and a Research Officer at the Federal Reserve Bank of New York. She has studied the political economy of inflation, the optimal taxation of capital and labor income, and the evolution of gender disparities in labor market outcomes. Her current research concerns the distribution of debt and defaults in the lead up and during the 2007-09 financial crisis and the determinants and consequences of personal bankruptcy. She is also working on the impact of changing trends in female participation on aggregate business cycles. Professor Albanesi completed her PhD in economics at Northwestern University and has a bachelor’s degree in economics from Bocconi University.
 Giacomo De Giorgi was born in Lecce (Italy) where he spent his first eighteen years. Then he moved to Milan where he met Paola and he got his laurea at the Universita’ “L. Bocconi”, final dissertation on ‘Wage differentials between Private and Public sectors’. He worked as a Researcher at the Fondazione Rodolfo Debenedetti (FRDB) in Milan, with Prof. Tito Boeri. He holds an MSc in Economics from the University of Warwick, final dissertation in applied microeconometrics, Adviser: Mark Stewart. His PhD is in development, labour economics, applied microeconometrics, Main Adviser Richard Blundell, at the Department of Economics of the University College London.
In July 2006 he joined the Department of Economics at Stanford University. From August 2010 to July 2011 he was on leave at UC-Berkeley. From August 2012 to June 2013 he was on leave at Columbia University as the Wesley Mitchell Visiting Professor and a regular visitor of the NY-Fed. Since June 2013 he is a Research Professor of ICREA-MOVE, Barcelona GSE and UAB. In September 2014 he joined the NY-Fed as a Senior Economist. In January of 2015 he was appointed Associate Editor of the Journal of the European Economic Association.
He is currently working on: household behavior; firms’ growth in less developed countries; education; climate and development; risk sharing and consumption insurance; business literacy and formalisation; indirect and general equilibrium effects of aid policies; demand estimation; social interactions; consumption inequality, migration; evaluation of ALMP’s. His work has appeared in the American Economic Review, the AEJ: Applied, the Journal of Public Economics, the Journal of the European Economic Association, the Economic Journal. He teaches Development Economics, Labour Economics, Economics of Human Resources, Advanced Econometrics.
 Jaromir Nosal is an Assistant Professor at the Department of Economics at Boston College. His research interests are Macroeconomics, International Finance and Household Finance.


