Written by Steven Hansen
This past week, data from the BEA showed personal income was improving nicely whilst consumer spending was muddling along.

This is not a brand new trend but has been occurring for most of 2015. The divergence of growth between income and expenditures is evident in the chart below.

For the 21st century during periods of expansion, disposable personal income and personal consumption have danced around 2.5% year-over-year growth. Expenditures has relatively small monthly variation but income gyrates widely.

It seems to me that the average Joe or Jane works within a fairly tight budget – with little month variance in income. In other words, I believe Joe and Jane spend all of their income – about 1/3 of all households in the USA have no savings. and over 40% of all adults do not have $500 in the bank. It is not much of a leap to conclude that the variation in income comes from the higher end of the earnings spectrum. As spending growth is decelerating, I would conclude the richer end of the economy is not spending their riches.
Consider that for most of the 21st century, consumer credit growth has been above 5% year-over-year. Consumer credit does not include home mortgages. This continued growth of consumer credit never adds up in my head – as this type of growth cannot continue forever.

At this point, half of the growth in consumer spending is fueled by the growth in consumer credit.

All loans need to be repaid, and the loan payments reduce the available funds which could be used for other purposes. The following graph shows the percent of consumer disposable income used to repay consumer loans (not including mortgages).
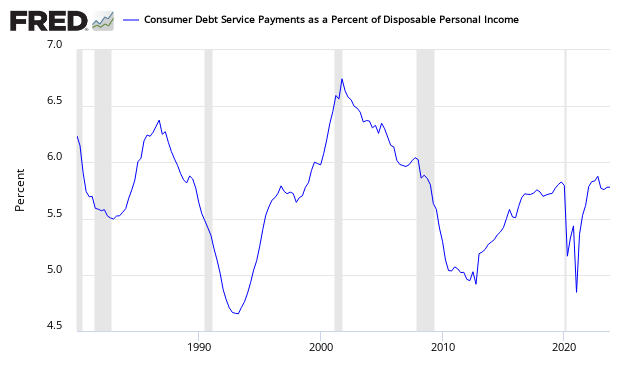
Is consumer credit growth beginning to limit spending? Whether that is happening now or not, who can argue that the recent trends are sustainable?
Other Economic News this Week:
The Econintersect Economic Index for November 2015 marginally improved – but remains in the low range of index values seen since the end of the Great Recession. The most tracked sectors of the economy generally showed some growth. Still our economic index remains in a long term decline since late 2014. Our employment six month forecast continues to forecast weakening employment growth.
The ECRI WLI growth index is now in positive territory but still indicates the economy will have little growth 6 months from today.
Current ECRI WLI Growth Index

The market (from Bloomberg) was expecting the weekly initial unemployment claims at 265 K to 282 K (consensus 270,000) vs the 260,000 reported. The more important (because of the volatility in the weekly reported claims and seasonality errors in adjusting the data) 4 week moving average moved from 271,000 (reported last week as 270,750) to 271,000. The rolling averages generally have been equal to or under 300,000 since August 2014.
Weekly Initial Unemployment Claims – 4 Week Average – Seasonally Adjusted – 2011 (red line), 2012 (green line), 2013 (blue line), 2014 (orange line), 2015 (violet line)

Bankruptcies this Week: Amsterdam, Netherlands-based Algoma Holdings (Chapter 15),


