Global Economic Intersection
Advertisement
  • Home
  • Economics
  • Finance
  • Politics
  • Investments
    • Invest in Amazon $250
  • Cryptocurrency
    • Best Bitcoin Accounts
    • Bitcoin Robot
      • Quantum AI
      • Bitcoin Era
      • Bitcoin Aussie System
      • Bitcoin Profit
      • Bitcoin Code
      • eKrona Cryptocurrency
      • Bitcoin Up
      • Bitcoin Prime
      • Yuan Pay Group
      • Immediate Profit
      • BitQH
      • Bitcoin Loophole
      • Crypto Boom
      • Bitcoin Treasure
      • Bitcoin Lucro
      • Bitcoin System
      • Oil Profit
      • The News Spy
      • Bitcoin Buyer
      • Bitcoin Inform
      • Immediate Edge
      • Bitcoin Evolution
      • Cryptohopper
      • Ethereum Trader
      • BitQL
      • Quantum Code
      • Bitcoin Revolution
      • British Trade Platform
      • British Bitcoin Profit
    • Bitcoin Reddit
    • Celebrities
      • Dr. Chris Brown Bitcoin
      • Teeka Tiwari Bitcoin
      • Russell Brand Bitcoin
      • Holly Willoughby Bitcoin
No Result
View All Result
Global Economic Intersection
No Result
View All Result

How Many Workers Are Missing? 5 million? 10 million?

admin by admin
March 15, 2014
in Uncategorized
0
0
SHARES
7
VIEWS
Share on FacebookShare on Twitter

Written by Steven Hansen

A post The Vast Majority of the 5.8 Million Missing Workers Are Under Age 55 got me thinking. This post uses participation rates, and contrary to popular opinion shows the majority of missing workers from the workforce are under 55 years old. This post can be summed up with their graph:

[click on the above graph to enlarge]

There is no disagreement with the premise that the vast majority of the “missing” workers are under age 55. The problem is calculating how many people are missing. As an analyst, I have no employment data which I believe is accurate. Let us look at the BLS definitions:

Employed: Persons 16 years and over in the civilian noninstitutional population who, during the reference week, (a) did any work at all (at least 1 hour) as paid employees; worked in their own business, profession, or on their own farm, or worked 15 hours or more as unpaid workers in an enterprise operated by a member of the family; and (b) all those who were not working but who had jobs or businesses from which they were temporarily absent because of vacation, illness, bad weather, childcare problems, maternity or paternity leave, labor-management dispute, job training, or other family or personal reasons, whether or not they were paid for the time off or were seeking other jobs. Each employed person is counted only once, even if he or she holds more than one job. Excluded are persons whose only activity consisted of work around their own house (painting, repairing, or own home housework) or volunteer work for religious, charitable, and other organizations.

Unemployed: Persons aged 16 years and older who had no employment during the reference week, were available for work, except for temporary illness, and had made specific efforts to find employment sometime during the 4-week period ending with the reference week. Persons who were waiting to be recalled to a job from which they had been laid off need not have been looking for work to be classified as unemployed.

Labor Force: The labor force includes all persons classified as employed or unemployed in accordance with the definitions contained in this glossary.

Labor Force Participation Rate: The labor force as a percent of the civilian noninstitutional population.

Who is Employed?

The BLS data has subtle but significant differences depending on what data set you use. Even talking about how many people are employed is different depending on the data set. The following graph highlights the problem.

Civilian Employment (blue line), the Headline Non-Farm Payrolls (red line), Headline Non-Farm Payrolls Used to Guess Total Employed (green line), Employment-Population Ratio times Civilian Noninstitutional Population (orange line covered by the blue line)

First, let us think about the green line in the above graph. Why is this a guess of the total people with jobs? From FRED:

…. Total Nonfarm Payroll is a measure of the number of U.S. workers in the economy that excludes proprietors, private household employees, unpaid volunteers, farm employees, and the unincorporated self-employed. This measure accounts for approximately 80 percent of the workers who contribute to Gross Domestic Product (GDP).

The orange line (covered by the blue line) is also interesting because both are determined by the household survey portion of the job report. The reason I showed both is to demonstrate the methodology used to develop the employment-population ratio.

Where I am going with this post?

I am trying to show that the data is far from definite even when one tries to get information on who actually works. Too many are not being counted, and the same is occurring with unemployment. If this is true, the participation rates are very suspect – and all numbers produced are at best back-of-envelope calculations.

For my “back of envelope” approach, there are a little over 10 million missing from the workforce based on population growth.

Potential Employment Growth based on Growth of Civilian Noninstitutional Population (red line) and Employment-Population Ratio times Civilian Noninstitutional Population (blue line)

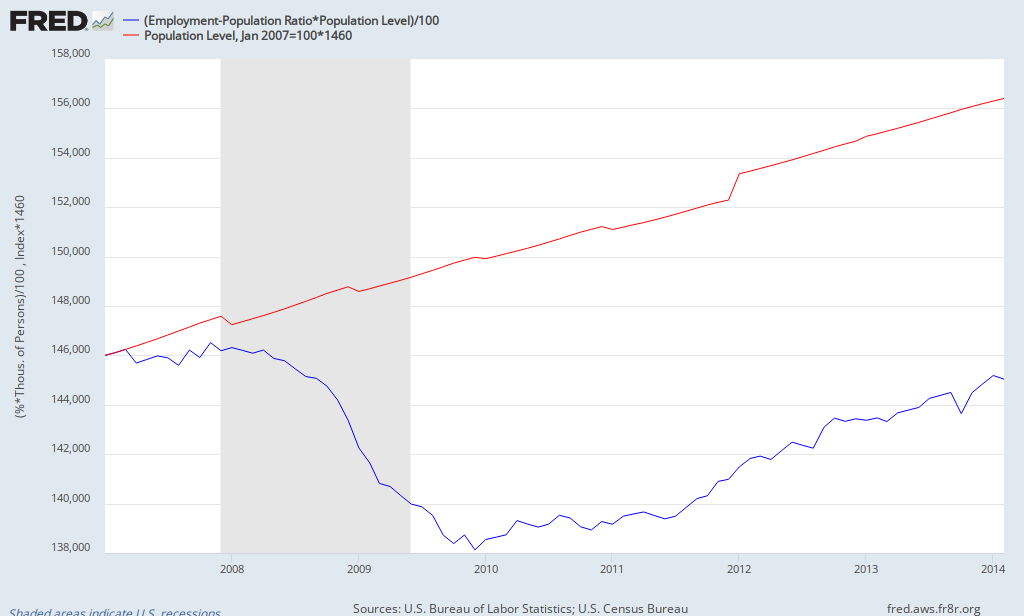
Potential jobs growth (red line) was based on growth of employment from January 2007 if jobs had grown at the same rate as population growth. From the graph one can note that this “gap” between potential jobs growth and real jobs growth is barely beginning to close.

The first step in solving a problem is to have accurate data. Employment data is not being collected in a manner which gives one confidence of relevance.

Other Economic News this Week:

The Econintersect Economic Index for March 2014 is showing a moderate growth deceleration. There are soft data points we watch outside of our index which bears watching. Nothing at this time is pointing to real economic contraction, but there is enough data sets in the warning track to let you know that the economy is far from running on all cylinders.

The ECRI WLI growth index value has been weakly in positive territory for over four months – but in a noticeable improvement trend. The index is indicating the economy six month from today will be slightly better than it is today.

Current ECRI WLI Growth Index

/images/z weekly_indexes.PNG

Initial unemployment claims went from 323,000 (reported last week) to 315,000 this week. Historically, claims exceeding 400,000 per week usually occur when employment gains are less than the workforce growth, resulting in an increasing unemployment rate. The real gauge – the 4 week moving average – marginally worsened from 336,750 (reported last week as 336,500) to 330,500. Because of the noise (week-to-week movements from abnormal events AND the backward revisions to previous weeks releases), the 4-week average remains the reliable gauge.

Weekly Initial Unemployment Claims – 4 Week Average – Seasonally Adjusted – 2011 (red line), 2012 (green line), 2013 (blue line), 2014 (orange line)

/images/z unemployment.PNG

Bankruptcies this Week: Privately-held Sbarro

Weekly Economic Release Scorecard:

Previous Post

What We Read Today 15 March 2014

Next Post

Trefis: Highlights Week Ending 14 March 2014

Related Posts

Bitcoin Price Sinks Below $26,750 As Fed Says Rate Hikes Are Not ‘Appropriate’
Economics

Bitcoin Price Sinks Below $26,750 As Fed Says Rate Hikes Are Not ‘Appropriate’

by John Wanguba
March 22, 2023
US Raises Interest Rates Despite Banking Mayhem
Business

US Raises Interest Rates Despite Banking Mayhem

by John Wanguba
March 22, 2023
Does Crypto Copy Trading Work?
Economics

Does Crypto Copy Trading Work?

by John Wanguba
March 22, 2023
Is crypto investment safe?
Economics

Is Crypto Investment Safe?

by John Wanguba
March 21, 2023
Bitcoin Price Surge Breathes Life Into Collapsing Crypto Firms
Economics

Bitcoin Price Surge Breathes Life Into Collapsing Crypto Firms

by John Wanguba
March 21, 2023
Next Post

Trefis: Highlights Week Ending 14 March 2014

Leave a Reply Cancel reply

Your email address will not be published. Required fields are marked *

Browse by Category

  • Business
  • Econ Intersect News
  • Economics
  • Finance
  • Politics
  • Uncategorized

Browse by Tags

adoption altcoins bank banking banks Binance Bitcoin Bitcoin market Bitcoin mining blockchain BTC business China crypto crypto adoption cryptocurrency crypto exchange crypto market crypto regulation decentralized finance DeFi Elon Musk ETH Ethereum Europe finance FTX inflation investment market analysis Metaverse mining NFT nonfungible tokens oil market price analysis recession regulation Russia stock market technology Tesla the UK the US Twitter

Archives

  • March 2023
  • February 2023
  • January 2023
  • December 2022
  • November 2022
  • October 2022
  • September 2022
  • August 2022
  • July 2022
  • June 2022
  • May 2022
  • April 2022
  • March 2022
  • February 2022
  • January 2022
  • December 2021
  • November 2021
  • October 2021
  • September 2021
  • August 2021
  • July 2021
  • June 2021
  • May 2021
  • April 2021
  • March 2021
  • February 2021
  • January 2021
  • December 2020
  • November 2020
  • October 2020
  • September 2020
  • August 2020
  • July 2020
  • June 2020
  • May 2020
  • April 2020
  • March 2020
  • February 2020
  • January 2020
  • December 2019
  • November 2019
  • October 2019
  • September 2019
  • August 2019
  • July 2019
  • June 2019
  • May 2019
  • April 2019
  • March 2019
  • February 2019
  • January 2019
  • December 2018
  • November 2018
  • October 2018
  • September 2018
  • August 2018
  • July 2018
  • June 2018
  • May 2018
  • April 2018
  • March 2018
  • February 2018
  • January 2018
  • December 2017
  • November 2017
  • October 2017
  • September 2017
  • August 2017
  • July 2017
  • June 2017
  • May 2017
  • April 2017
  • March 2017
  • February 2017
  • January 2017
  • December 2016
  • November 2016
  • October 2016
  • September 2016
  • August 2016
  • July 2016
  • June 2016
  • May 2016
  • April 2016
  • March 2016
  • February 2016
  • January 2016
  • December 2015
  • November 2015
  • October 2015
  • September 2015
  • August 2015
  • July 2015
  • June 2015
  • May 2015
  • April 2015
  • March 2015
  • February 2015
  • January 2015
  • December 2014
  • November 2014
  • October 2014
  • September 2014
  • August 2014
  • July 2014
  • June 2014
  • May 2014
  • April 2014
  • March 2014
  • February 2014
  • January 2014
  • December 2013
  • November 2013
  • October 2013
  • September 2013
  • August 2013
  • July 2013
  • June 2013
  • May 2013
  • April 2013
  • March 2013
  • February 2013
  • January 2013
  • December 2012
  • November 2012
  • October 2012
  • September 2012
  • August 2012
  • July 2012
  • June 2012
  • May 2012
  • April 2012
  • March 2012
  • February 2012
  • January 2012
  • December 2011
  • November 2011
  • October 2011
  • September 2011
  • August 2011
  • July 2011
  • June 2011
  • May 2011
  • April 2011
  • March 2011
  • February 2011
  • January 2011
  • December 2010
  • August 2010
  • August 2009

Categories

  • Business
  • Econ Intersect News
  • Economics
  • Finance
  • Politics
  • Uncategorized
Global Economic Intersection

After nearly 11 years of 24/7/365 operation, Global Economic Intersection co-founders Steven Hansen and John Lounsbury are retiring. The new owner, a global media company in London, is in the process of completing the set-up of Global Economic Intersection files in their system and publishing platform. The official website ownership transfer took place on 24 August.

Categories

  • Business
  • Econ Intersect News
  • Economics
  • Finance
  • Politics
  • Uncategorized

Recent Posts

  • Bitcoin Price Sinks Below $26,750 As Fed Says Rate Hikes Are Not ‘Appropriate’
  • US Raises Interest Rates Despite Banking Mayhem
  • Does Crypto Copy Trading Work?

© Copyright 2021 EconIntersect - Economic news, analysis and opinion.

No Result
View All Result
  • Home
  • Contact Us
  • Bitcoin Robot
    • Bitcoin Profit
    • Bitcoin Code
    • Quantum AI
    • eKrona Cryptocurrency
    • Bitcoin Up
    • Bitcoin Prime
    • Yuan Pay Group
    • Immediate Profit
    • BitIQ
    • Bitcoin Loophole
    • Crypto Boom
    • Bitcoin Era
    • Bitcoin Treasure
    • Bitcoin Lucro
    • Bitcoin System
    • Oil Profit
    • The News Spy
    • British Bitcoin Profit
    • Bitcoin Trader
  • Bitcoin Reddit

© Copyright 2021 EconIntersect - Economic news, analysis and opinion.

en English
ar Arabicbg Bulgarianda Danishnl Dutchen Englishfi Finnishfr Frenchde Germanel Greekit Italianja Japaneselv Latvianno Norwegianpl Polishpt Portuguesero Romanianes Spanishsv Swedish