by Lee Adler, Wall Street Examiner
It was the best of times. It was the worst of times. Allow me to use last week’s new home sales report from the Census Bureau to illustrate.
New home sale prices in April rose 8.3% year over year.

New home sale prices are based on current contracts in the survey month so they give us a near real-time take on the state of the market.
This is unlike the ridiculous Case-Shiller data, which at the release date is not only 4 months late relative to the date the sales were actually contracted, but are then smoothed to a 3 month average price. That puts the lag at the release date at 5.5 months. The Case Shiller data released this morning shows average contract prices as of December-January. Who cares about that? It’s summer already. Why does the media waste our time with old stale information on where a 3 month moving average was at the end of March for sales that took place in December?
But the lag isn’t the chief problem.
The Case Shiller (maybe we should call it the Case Chiller) method is not only slow, it suppresses the actual inflation rate of housing. The inflation rate for new homes has been running at a compound annual rate of +7.4% since the price bottom in 2010. That compares with an annual inflation rate of +5.6% during the last bubble. Do these prices represent the “best of times” or perhaps a dangerously inflated bubble?

Bubble or Not – Click to enlarge
Rising at 7.4% per year, new house sale prices today are now 26% above the last housing bubble top in 2006. Over the same period, median household income has risen at the rate of 1.1% per year. As house prices rise faster than incomes, fewer and fewer households can afford them. That’s what happens in a bubble.
This isn’t the only data showing house prices heating up. National online real estate broker Redfin reports actual contract prices in the largest US metros. Their latest data for April shows the year to year price change accelerating to +6.5% for existing homes. At the same time, Redfin shows listing prices rising 7.8% year over year, as listing inventory remains extremely tight. Inventories have not increased at all since this time last year. Under these conditions, any increase in demand at all will send prices soaring.
I have studied the issue of real time listing prices versus subsequently published sale price data and they have always strongly correlated. I have several years of personal experience selling real estate many years ago, and spent many more years working in the real estate industry, including 15 years as a professional real estate market analyst. Real time listing price trends do accurately reflect price trends and the pace of price increase. Sellers aren’t stupid. They are raising their asking prices now because their realtors are giving them feedback that they can get those higher prices. They’re probably right.
As long as builders are getting free financing from the Fed, they’ll build expensive houses for those at the top of the income spectrum to whom the benefits of ZIRP and QE also accrue, and those people will continue to buy them. So it is that the census bureau concluded, based on its survey of builders in April, that builders sold 49,000 houses that month, which was a whopping 26% higher than April 2014. They’re selling more houses at higher prices. It is the best of times for them, and for the buyers who can afford those houses.
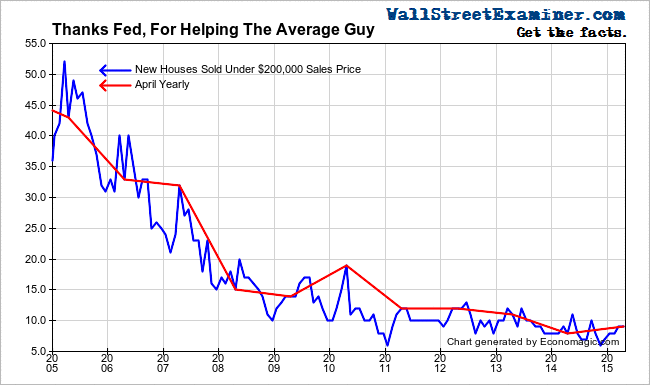
Meanwhile, the median income household earning $52,000 per year can only afford to buy a house that costs less than $200,000. How many of those houses did builders sell to the millions of US middle income families in April? 9,000 houses… In peak selling season… Nine thousand… A 4 digit number…
True, that’s up 1,000 from last April, but below every year before that. Every year! The picture speaks for itself. The middle class has become less and less able to afford a new home. A Mr. Wonderful market it ain’t. The American dream is dead to the middle income household.

How Fed Policy Helps The Average Family – Click to enlarge
So it is “the best of times” for ZIRP/QE beneficiaries. It is the “worst of times” for median income households and below. This is the Tale of Two Economies that isn’t told in the headline numbers which the mainstream media spew every day. If the foundation is rotting, the tower of interest free debt driven pricing and activity built upon that rotting base will almost certainly eventually collapse.
This time is different from inflationary bubble times that have gone before in one important way. The central banks have become the bubble speculators, betting that they can keep the bubble going indefinitely. Are you willing to accept that bet?


