Written by Steven Hansen
I am confused. Using some measures, health care costs are deflating whilst other measures say real health care costs per family are accelerating.

The following tidbit appeared in our Early Headlines post:
Healthcare Inflation (Sober Look, Talk Markets) Healthcare expense in the PCE (personal consumption expenditures) inflation index has been deflating for almost the entire time since late 2008. See Health Care Services Depress Recent PCE Inflation Readings (Dallas Fed). But why, then do we see headlines like the preceding article? Because millions more people are receiving healthcare and that costs more money. The cause of rising aggregate health care expenditures is more people, not rising costs for services.

Sources: BEA, Dallas Fed
Yet insurance costs are increasing at a fast clip according the the BLS.

source: BLS
And even looking at the BEA’s own data – the inflation adjusted health care costs service per capita are accelerating. [Total health care costs are estimated to exceed $10,000 per capita in 2016].
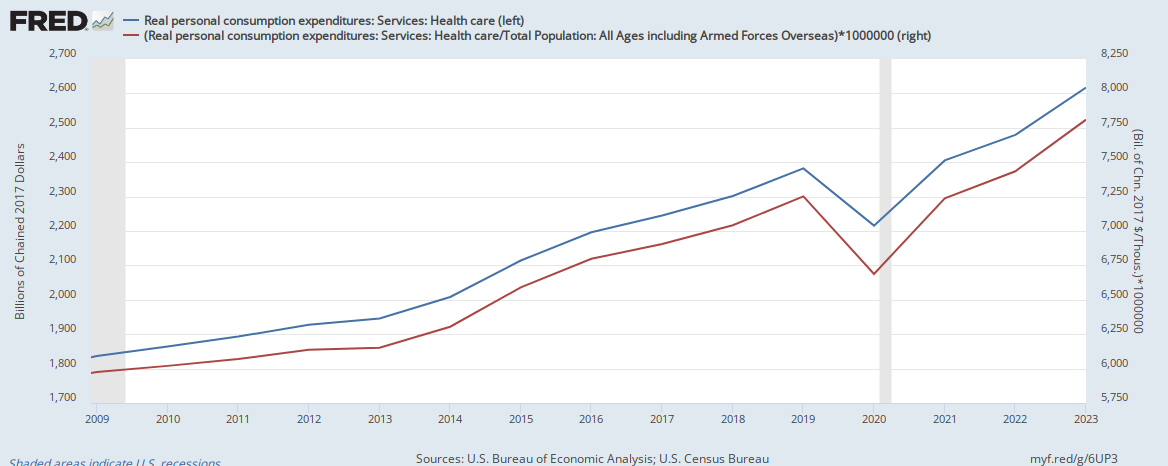
source: BEA, FRED
So let me understand, the cost of health care per capita is growing faster than ever, and we are enjoying a deflationary period in health care costs.
Is it possible that both are true?
- Is the inflation index related to the cost of individual procedures – and the cost of individual procedures falling whilst the number of procedures is rising?
- Are the insurance company losses in the Obamacare marketplaces is subsidizing health care costs?
I posed these questions to the BEA, Kyle Brown Chief, PCE Branch who responded in part:
….. In particular you can see the PCE healthcare prices level off a bit in recent years, but in the last couple of years (2014-2015) the quantity index is showing larger increases than the other years since 2008. This would indicate that more people are consuming healthcare services than in past years.
I cannot speculate as to why people are consuming more healthcare services in recent years, but the real PCE estimates do indicate this is the case and perhaps the increasing number of people of covered by insurance and government programs is playing a role. Note that our Healthcare services prices are based on PPI and CPI data from the BLS and would reflect the total cost of services provided by the particular facilities (i.e., hospital, physician office, outpatient care facility, etc.). Our nominal estimates are primarily based on revenue from Census Services Surveys and the Economic Census. PCE healthcare spending includes spending both by persons (out of pocket) and on their behalf (by insurance coverage, Medicare, Medicaid, etc.). More information on our methodology is available in Chapter 5 of the NIPA handbook here: http://www.bea.gov/methodologies/index.htm#national_meth.
Medical procedures are not like TVs or smartphones – few spend money on medical procedures that are not necessary. Spending more on health care per capita shows costs are rising if you view health care costs as a single entity instead of a series of small ones. Health care costs are being viewed as trees and not the forest.
According to the BEA, health care is a large and growing share of the U.S. economy – 17.4% of GDP in 2013. Some suggest it will be 20% of the economy by 2020. Yet the BEA has not updated its health care costs module since calendar year 2012. Seems like somebody is being being naughty shielding the public from health care cost facts.
And if all this is true, BEA personal income and expenditure price index is UNDERSTATING inflation, and real GDP is overstated.
Other Economic News this Week:
The Econintersect Economic Index for September 2016 is showing better growth for the second month in a row – but the rate of growth outlook remains weak. The index remains near the lowest value since the end of the Great Recession. There remain recession warning flags in some of the data we are reviewing..
Bankruptcies this Week: ScripsAmerica


