Written by Steven Hansen
Pundits are all over the map on the future direction of the economy. Many are simply optimists (or pessimists) regurgitating baseless and emotional views. But even those with a good understanding of current macroeconomic data have differing views.

Generally, macroeconomic pundits are wary of the current situation in the USA as economic growth is so near the zero line that any misreading of the tea leaves can draw very wrong conclusions.
As an example, the NBER (which is tasked with identifying recessions) uses the big four identifiers:
A recession is a significant decline in economic activity spread across the economy, lasting more than a few months, normally visible in real GDP, real income, employment, industrial production, and wholesale-retail sales. A recession begins just after the economy reaches a peak of activity and ends as the economy reaches its trough. Between trough and peak, the economy is in an expansion. Expansion is the normal state of the economy; most recessions are brief and they have been rare in recent decades.
….. The committee places particular emphasis on two monthly measures of activity across the entire economy: (1) personal income less transfer payments, in real terms and (2) employment. In addition, we refer to two indicators with coverage primarily of manufacturing and goods: (3) industrial production and (4) the volume of sales of the manufacturing and wholesale-retail sectors adjusted for price changes.
Below is a graph looking at the month-over-month change (note that multipliers have been used to make changes more obvious).
Month-over-Month Growth Personal Income less transfer payments (blue line), Employment (red line), Industrial Production (green line), Business Sales (orange line)
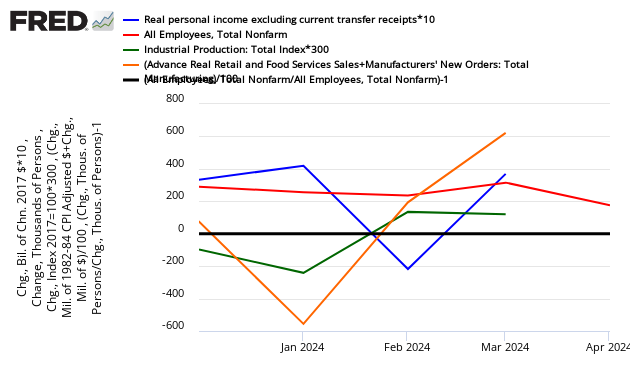
In the above graph, if a line falls below 0 (black line) – that sector is contracting from the previous month. At his point, although much of the data is soft, three of the four metrics show growth for the past two months, an improvement over the four preceding months. Again, this is a rear view mirror, is subject to revision, and is not predictive of where the economy is going. Another way to look at the same data sets is in the graph below which uses indexed real values from the trough of the Great Recession.
Indexed Growth Personal Income less transfer payments (red line), Employment (green line), Industrial Production (blue line), Business Sales (orange line)
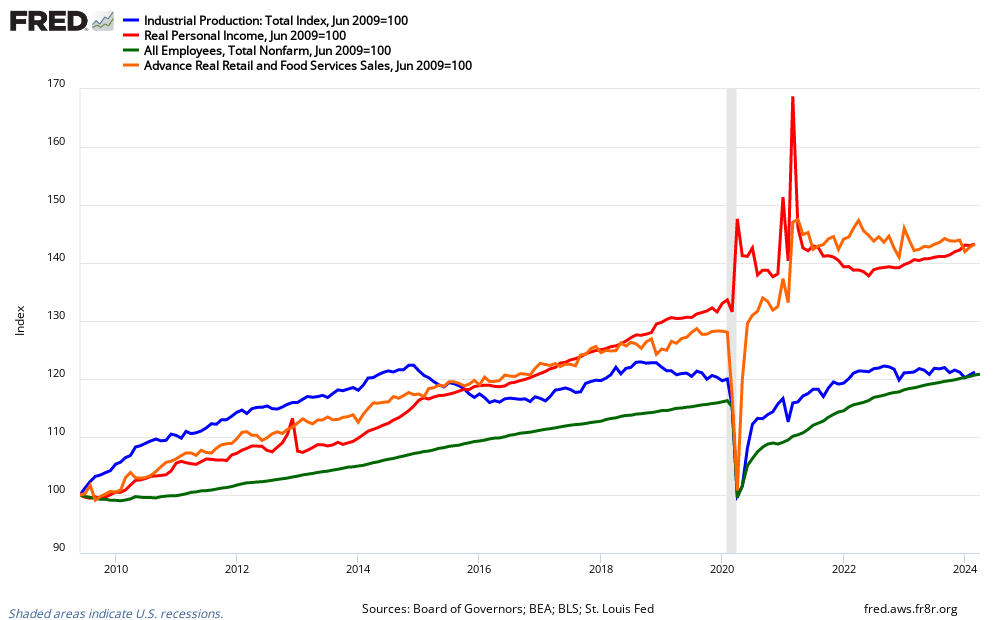
Notice the contraction of business sales and manufacturing. Employment and personal income are still improving within normal ranges for times of economic expansion. But consider whether a recession can hit with employment (it did in 1973) and income growth (see graph below) still expanding.

I am questioning whether traditional indicators and other indices are valid in the New Normal.
My concern continues to be that everybody is missing the primary dynamics of the New Normal. It is possible that an economic dynamic previously seen as coincident or leading in economic cycles may have gone the way of the appendix. From WebMd:
Normally, the appendix sits in the lower right abdomen. The function of the appendix is unknown. One theory is that the appendix acts as a storehouse for good bacteria, “rebooting” the digestive system after diarrheal illnesses. Other experts believe the appendix is just a useless remnant from our evolutionary past.
Just comparing a real science (medical) with economics (opinion driven) brings a smile to my face.
Other Economic News this Week:
The Econintersect Economic Index for April 2016 again insignificantly improved but remains relatively weak. The index continues near one of the lowest values since the end of the Great Recession. This marginal index improvement is due to data being compared against relatively soft data – both month-over-month and year-over-year. Our employment six month forecast is for slightly weaker employment growth for April – and the long term decline in the employment forecast remains in play.
Economic Cycle Research Institute (ECRI) Weekly Leading Index (WLI) Growth Index is now in positive territory and forecasting a marginally strengthening economy six months from now.
Current ECRI WLI Growth Index

The market expectations for weekly initial unemployment claims (from Bloomberg) were 263,000 to 275,000 (consensus 267,000), and the Department of Labor reported 294,000 new claims. The more important (because of the volatility in the weekly reported claims and seasonality errors in adjusting the data) 4 week moving average moved from 258,000 (reported last week as 258,000) to 268,250. The rolling averages generally have been equal to or under 300,000 since August 2014.
Weekly Initial Unemployment Claims – 4 Week Average – Seasonally Adjusted – 2011 (red line), 2012 (green line), 2013 (blue line), 2014 (orange line), 2015 (violet line)

Bankruptcies this Week: Legend International Holdings, Chaparral Energy, LINN Energy, Penn Virginia


