Written by Steven Hansen
The problem I have with employment data is that it cannot be validated with any precision in real time.

You would think in 2016 with internet connectivity there should be no issue assembling accurate data in real time. Yet, the BLS uses two forms of ESTIMATING employment that are straight out of the dark ages:
- the household survey which surveys 50,000 to about 60,000 eligible households EACH month. The BLS says that for monthly change in the household survey employment to be significant, it must be plus or minus 500,000.
- the establishment survey sample covers over one-third of total employment universe. An over-the-month employment change of about plus or minus 100,000 is statistically significant
Whoa. That is a huge accuracy window for a piece of government data that the markets consider to be a very important document. Is the meaning of these sentences designed to be purposely ambiguous?
The establishment and household surveys have slightly different sets within the employment universe so it cannot be expected that they match EXACTLY each month – but the rates of growth when viewed year-over-year should reasonably match. This is partly because the monthly errors should balance (wash) out.
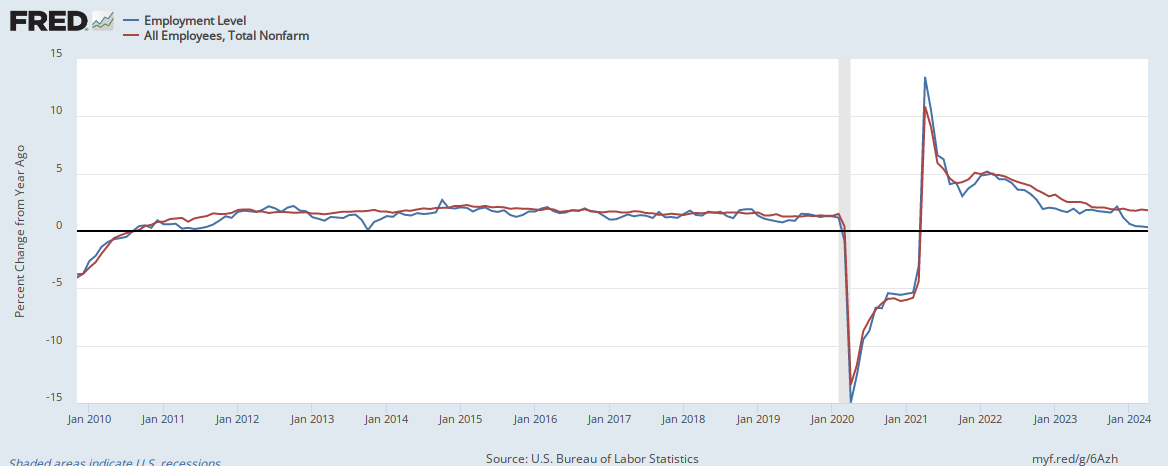
Looking at the seasonally adjusted data on the graph below – the YoY growth rates are household = 1.78%, and the establishment = 1.72%. And compare the year-over-year variation on the graph below – does it give you confidence that the establishment survey (red line) has little variance?
seasonally adjusted comparison:
Currently the red and blue lines are reasonably close – but consider that each 0.01% difference is 15,000 jobs. Mathematically this is a 90,000 difference in growth between the seasonally adjusted establishment and household surveys.
Many government agencies use UNADJUSTED data to state the year-over-year growth rate – and in all events, there should be negligible difference between the seasonally adjusted and non-adjusted data when looking at year-over-year growth. For the unadjusted data the year-over-year growth difference is larger for the household data (household = 1.81%, and the establishment = 1.70%). This difference equates to 165,000 jobs or nearly an average month’s growth over the past year.
unadjusted comparison:

Consider that the household data’s difference between the adjusted and unadjusted is -45,000 jobs (1.78% minus 1.81%) whilst the establishment survey’s difference is +120,000 jobs (1.78% minus 1.70%). As the establish survey is used headlining jobs were created, if I were a cynic – I would suggest somebody has a finger on the scales – especially in an election year.
After all, one could add 10,000s of jobs to this month, and 10,000s of jobs to that month – and then wash the gains out on the annual revisions when no one cared.
But my issue is NOT data manipulation – it is that there are currently no way to validate the data. Compliant systems have validation – an alternate way of deriving the information, then reconciliation with errata. What could be used?
- social security payments by ss number
- unemployment insurance payees by ss number
Yet these systems too remain in the dark ages – not even close to producing real time information. This is very embarrassing for an advanced economy in the 21st century.
And in one final attempt to validate the employment growth rate, I used inflation adjusted BEA private wages and salaries (table 2.6) growth from personal income (blue line). The BLS non-farm payrolls is the red line.

What initially struck me looking at this graph was that wage income varied significantly month-to-month – and so did the BLS household employment survey. So below is the same graph using the household survey instead of the establishment survey.

Again, the data did not correlate well but the overall correlation was better.
The smooth year-over-year employment growth in the establishment survey should twig curiosity that the data is being overly manipulated. Both seasonally adjusted BEA wage income and the seasonally adjusted BLS household surveys have significant year-over-year variation each month.
I suspect few in government or in the financial sector care whether employment data is correct – but only care that the news is good. I care as it is a tool to track the economy – and it seems worthless as an economic tracking tool in anything close to real time.
Other Economic News this Week:
The Econintersect Economic Index for August 2016 is no longer in contraction but its level correlating to snail’s pace economic growth. The index remains near the lowest value since the end of the Great Recession.
Bankruptcies this Week: LRI Holdings (Logan’s Roadhouse)


