


from The Conversation
— this post authored by Christopher Ruf, University of Michigan
Plastic is the most common type of debris floating in the world’s oceans. Waves and sunlight break much of it down into smaller particles called microplastics – fragments less than 5 millimeters across, roughly the size of a sesame seed.

Please share this article – Go to very top of page, right hand side, for social media buttons.
To understand how microplastic pollution is affecting the ocean, scientists need to know how much is there and where it is accumulating. Most data on microplastic concentrations comes from commercial and research ships that tow plankton nets – long, cone-shaped nets with very fine mesh designed for collecting marine microorganisms.
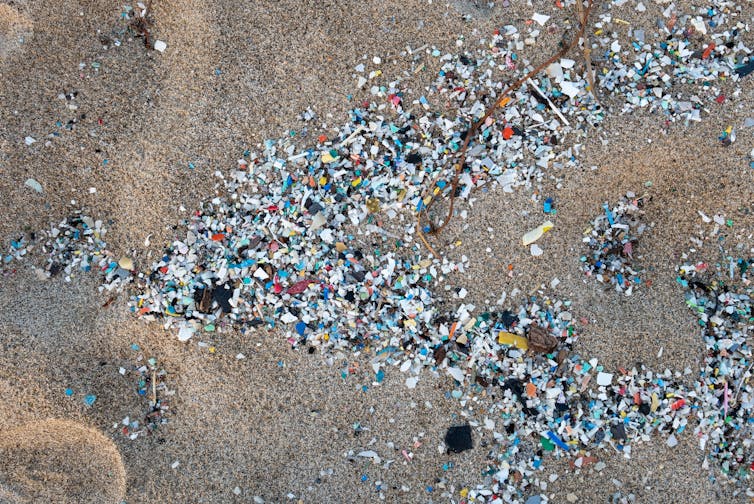
Plastic fragments washed onto Schiavonea beach in Calabria, Italy, in a 2019 storm. Alfonso Di Vincenzo/KONTROLAB /LightRocket via Getty Images
But net trawling can sample only small areas and may be underestimating true plastic concentrations. Except in the North Atlantic and North Pacific gyres – large zones where ocean currents rotate, collecting floating debris – scientists have done very little sampling for microplastics. And there is scant information about how these particles’ concentrations vary over time.
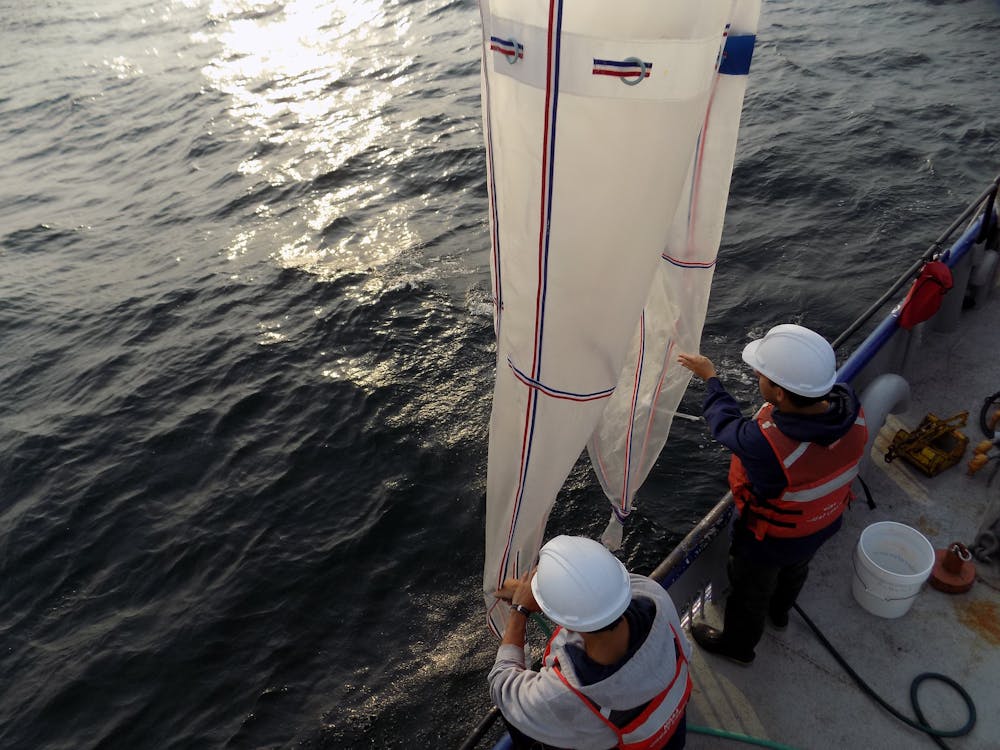
Researchers deploy plankton sampling nets in Lake Michigan. NOAA, CC BY-SA
To address these questions, University of Michigan research assistant Madeline Evans and I developed a new way to detect microplastic concentrations from space using NASA’s Cyclone Global Navigation Satellite System. CYGNSS is a network of eight microsatellites that was launched in 2016 to help scientists predict hurricanes by analyzing tropical wind speeds. They measure how wind roughens the ocean’s surface – an indicator that we realized could also be used to detect and track large quantities of microplastics.
Looking for smooth zones
Annual global production of plastic has increased every year since the 1950s, reaching 359 million metric tons in 2018. Much of it ends up in open, uncontrolled landfills, where it can wash into river drainage zones and ultimately into the world’s oceans.
Researchers first documented plastic debris in the oceans in the 1970s. Today, it accounts for an estimated 80% to 85% of marine litter.
The radars on CYGNSS satellites are designed to measure winds over the ocean indirectly by measuring how they roughen the water’s surface. We knew that when there is a lot of material floating in the water, winds don’t roughen it as much. So we tried computing how much smoother measurements indicated the surface was than it should have been if winds of the same speed were blowing across clear water.
This anomaly – the “missing roughness” – turns out to be highly correlated with the concentration of microplastics near the ocean surface. Put another way, areas where surface waters appear to be unusually smooth frequently contain high concentrations of microplastics. The smoothness could be caused by the microplastics themselves, or possibly by something else that’s associated with them.
By combining all the measurements made by CYGNSS satellites as they orbit around the world, we can create global time-lapse images of ocean microplastic concentrations. Our images readily identify the Great Pacific Garbage Patch and secondary regions of high microplastic concentration in the North Atlantic and the southern oceans.
Tracking microplastic flows over time
Since CYGNSS tracks wind speeds constantly, it lets us see how microplastic concentrations change over time. By animating a year’s worth of images, we revealed seasonal variations that were not previously known.
This animation shows how satellite data can be used to track where microplastics enter the water, how they move and where they tend to collect.
We found that global microplastic concentrations tend to peak in the North Atlantic and Pacific during the Northern Hemisphere’s summer months. June and July, for example, are the peak months for the Great Pacific Garbage Patch.
Concentrations in the Southern Hemisphere peak during its summer months of January and February. Lower concentrations during the winter in both hemispheres are likely due to a combination of stronger currents that break up microplastic plumes and increased vertical mixing – the exchange between surface and deeper water – that transports some of the microplastic down below the surface.
This approach can also target smaller regions over shorter periods of time. For example, we examined episodic outflow events from the mouths of the China’s Yangtze and Qiantang rivers where they empty into the East China Sea. These events may have been associated with increases in industrial production activity, or with increases in the rate at which managers allowed the rivers to flow through dams.
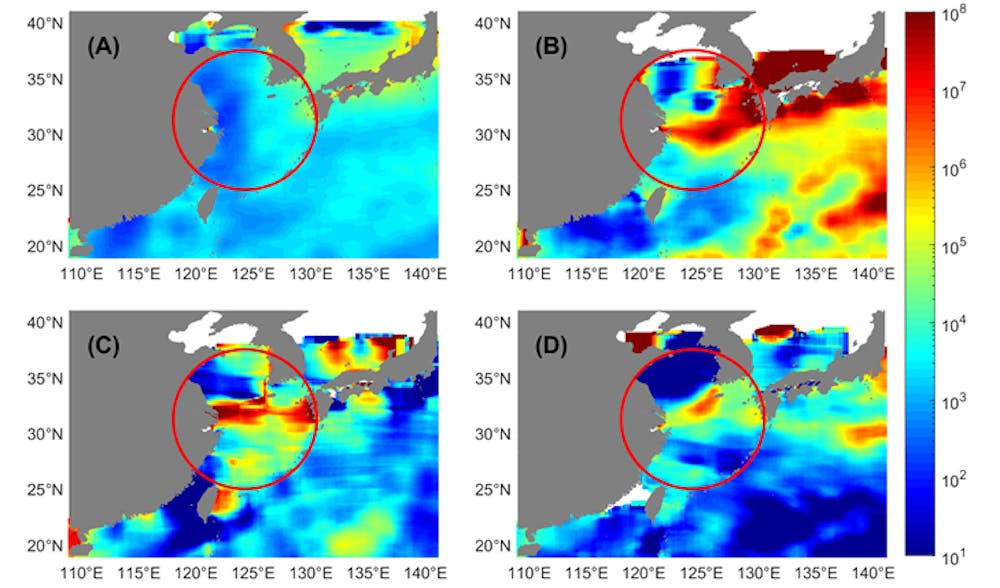
These images show microplastic concentrations (number of particles per square kilometer) at the mouths of the Yangtze and Qiantang rivers where they empty in to the East China Sea. (A) Average density year-round; (B) short-lived burst of particles from the Qiantang River; (C and D) short-lived bursts from the Yangtze River. Evans and Ruf, 2021., CC BY
Better targeting for cleanups
Our research has several potential uses. Private organizations, such as The Ocean Cleanup, a nonprofit in The Netherlands, and Clewat, a Finnish company specializing in clean technology, use specially outfitted ships to collect, recycle and dispose of marine litter and debris. We have begun conversations with both groups and hope eventually to help them deploy their fleets more effectively.
Our spaceborne imagery may also be used to validate and improve numerical prediction models that attempt to track how microplastics move through the oceans using ocean circulation patterns. Scholars are developing several such models.
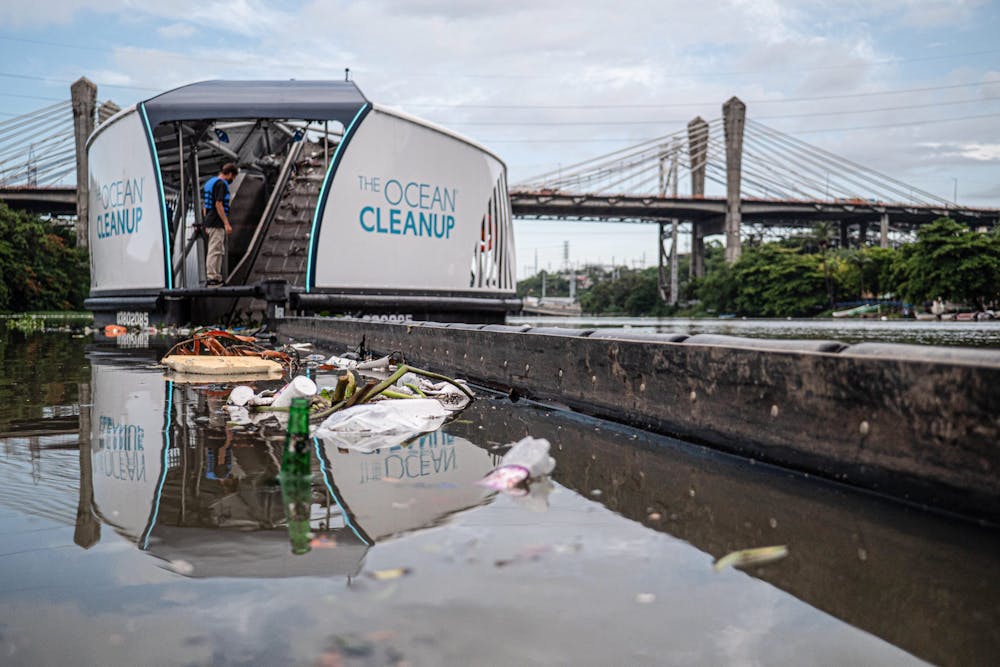
A solar-powered barge that filters plastic out of water, designed by Dutch NGO The Ocean Cleanup, deployed in the Rio Ozama, Dominican Republic, in 2020. The Ocean Cleanup, CC BY
While the ocean roughness anomalies that we observed correlate strongly with microplastic concentrations, our estimates of concentration are based on the correlations that we observed, not on a known physical relationship between floating microplastics and ocean roughness. It could be that the roughness anomalies are caused by something else that is also correlated with the presence of microplastics.
One possibility is surfactants on the ocean surface. These liquid chemical compounds, which are widely used in detergents and other products, move through the oceans in ways similar to microplastics, and they also have a damping effect on wind-driven ocean roughening.
Further study is needed to identify how the smooth areas that we identified occur, and if they are caused indirectly by surfactants, to better understand exactly how their transport mechanisms are related to those of microplastics. But I hope this research can be part of a fundamental change in tracking and managing microplastic pollution.
[The Conversation’s science, health and technology editors pick their favorite stories. Weekly on Wednesdays.]
Christopher Ruf, Professor of Climate and Space Sciences and Engineering, University of Michigan
This article is republished from The Conversation under a Creative Commons license. Read the original article.
.


