


Written by rjs, MarketWatch 666
 Here are some selected news articles from the week ended 12 October 2019.
This article is a feature every Monday evening on GEI.
Please share this article – Go to very top of page, right hand side, for social media buttons.
Global oil shortage at 3.38 million barrels per day in Sept as OPEC output fell 1.32 mbpd, non OPEC output fell 0.45 mbpd
Oil prices ended higher this past week, as prospects for a US-China trade deal rallied financial and commodity markets worldwide….after falling more than 5% to $52.81 a barrel on weak economic data and the Saudi’s production recovery last week, prices for US light sweet crude for November delivery initially rose more than $1 on Monday, as deadly anti-government demonstrations gripped Iraq, but gave up those gains to close 6 cents lower at $52.75 a barrel, pressured by prevailing worries over energy demand, despite reports of a drop in OPEC output….with U.S.-China trade talks looming over oil markets, oil prices fell again on Tuesday as US blacklisting of more Chinese companies dampened hopes for a quick trade deal, but closed down just 12 cents at 52.63 a barrel, as unrest in Iraq and Ecuador lent support to prices… oil prices slipped for a third consecutive session on Wednesday as the prospect of the United States and China striking a trade deal in talks this week dimmed, and ended 4 cents lower at 52.59 a barrel, as minutes from the Fed’s September meeting raised economic worries and the weekly EIA data revealed a fourth straight rise in domestic crude supplies…oil prices initially fell more than $1 on Thursday on concerns of trade-war related lower fuel demand, but then rallied on comments by OPEC Secretary-General Barkindo that they would take action to balance oil markets at their December meeting and closed 96 cents higher at $53.55 a barrel…oil prices edged slowly higher early on Friday, on hopes for deeper OPEC output cuts and hopes for a US-China trade pact, then jumped more than 2% after Iranian media said a state-owned oil tanker was attacked near Saudi Arabia, and went on to close $1.15 higher at $54.70 a barrel, on reports that the U.S. and China had reached partial agreement that could lead to a truce in the trade war…oil prices were thus able to log a weekly gain of nearly 4%, in their first weekly increase since the September 14th drone strikes on Saudi oil facilities..
Natural gas prices, on the other hand, fell every day this past week and ended lower for a 4th consecutive week, as record production and weak demand continued to weigh on prices…after falling 2.2% to $2.352 per mmBTU on record production and weak demand last week, the contract price of natural gas for November delivery fell 4.9 cents or more than 2% on Monday after natural gas production had increased to a new all-time high over the weekend and the weather pattern shifted to indicate below normal demand…gas prices then fell 1.5 cents on Tuesday and another 5.4 cents on Wednesday, as forecasts lessened the odds of a durable early season cold snap, thus pushing prices lower…prices slipped another 1.6 cents on Thursday on an EIA natural gas storage report that was higher than expected but still within the range of the various market estimates and then inched down another four-tenths of a cent on Friday to end the week at $2.214 per mmBTU, down 5.9% from the prior Friday and down 18.6% from its September 16th close…
The natural gas storage report for the week ending October 4th from the EIA indicated that the quantity of natural gas held in storage in the US increased by 98 billion cubic feet to 3,415 billion cubic feet by the end of the week, which meant our gas supplies were 472 billion cubic feet, or 16.0% more than the 2,943 billion cubic feet that were in storage on October 4th of last year, while still 9 billion cubic feet, or 0.3% below the five-year average of 3,423 billion cubic feet of natural gas that have been in storage as of the 4th of October in recent years….this week’s 98 billion cubic feet injection into US natural gas storage was more than the consensus forecast for a 94 billion cubic feet injection from analysts surveyed by S&P Global Platts, and it was also above the average 89 billion cubic feet of natural gas that have been added to gas storage during the first week of October over the past 5 years, the 28th such average or above average storage build in the last 30 weeks…the 2,237 billion cubic feet of natural gas that have been added to storage over the 28 weeks of this year’s injection season is the second most for the same period in the modern record, eclipsed only by the record 2294 billion cubic feet of natural gas that were injected into storage over the same 28 weeks of the 2014 natural gas injection season, a coolish summer when there were no injections below 76 billion cubic feet … .
The Latest US Oil Supply and Disposition Data from the EIA
US oil data from the US Energy Information Administration for the week ending October 4th showed that because of a deepening slowdown in our oil refining, we were left with surplus oil to add to storage for the fourth week in a row…our imports of crude oil fell by an average of 67,000 barrels per day to an average of 6,224,000 barrels per day, after falling by an average of 87,000 barrels per day during the prior week, while our exports of crude oil rose by an average of 534,000 barrels per day to an average of 3,401,000 barrels per day during the week, which meant that our effective trade in oil worked out to a net import average of 2,823,000 barrels of per day during the week ending October 4th, 601,000 fewer barrels per day than the net of our imports minus exports during the prior week…over the same period, the production of crude oil from US wells was reported to be 200,000 barrels per day higher at a record 12,600,000 barrels per day, so our daily supply of oil from the net of our trade in oil and from well production totaled an average of 15,423,000 barrels per day during this reporting week..
US oil refineries were reportedly processing 15,656,000 barrels of crude per day during the week ending October 4th, 496,000 fewer barrels per day than the amount of oil they used during the prior week, while over the same period the EIA reported that a net average of 389,000 barrels of oil per day were being added to the supplies of oil stored in the US….hence, this week’s crude oil figures from the EIA appear to indicate that our total working supply of oil from net imports and from oilfield production was 623,000 barrels per day less than what was reportedly added to storage plus what our oil refineries reported they used during the week….to account for that disparity between the apparent supply of oil and the apparent disposition of it, the EIA inserted a (+623,000) barrel per day figure onto line 13 of the weekly U.S. Petroleum Balance Sheet to make the reported data for the daily supply of oil and the consumption of it balance out, essentially a fudge factor that they label in their footnotes as “unaccounted for crude oil”….with that much oil unaccounted for again this week, it calls into question all the other oil metrics that the EIA has reported and that we have just transcribed (for more on how this weekly oil data is gathered, and the possible reasons for that “unaccounted for” oil, see this EIA explainer)….
Further details from the weekly Petroleum Status Report (pdf) indicated that the 4 week average of our oil imports fell to an average of 6,486,000 barrels per day last week, now 16.8% less than the 7,797,000 barrel per day average that we were importing over the same four-week period last year….the 389,000 barrel per day net increase in our total crude inventories included 418,000 barrels per day that were added to our commercially available stocks of crude oil, which was offset by a withdrawal of 29,000 barrels per day from our Strategic Petroleum Reserve….this week’s crude oil production was reported to be 100,000 barrels per day higher at a record 12,600,000 barrels per day because the rounded estimate of the output from wells in the lower 48 states was 100,000 barrels per day higher at a record 12,100,000 barrels per day, while a 8,000 barrels per day decrease to 473,000 barrels per day in Alaska’s oil production ha no impact on the final rounded national production total…last year’s US crude oil production for the week ending October 4th was rounded to 11,200,000 barrels per day, so this reporting week’s rounded oil production figure was 12.5% above that of a year ago, and 49.5% more than the interim low of 8,428,000 barrels per day that US oil production fell to during the last week of June of 2016…
Meanwhile, US oil refineries were operating at 86.4% of their capacity in using 15,656,000 barrels of crude per day during the week ending October 4th, down from 86.4% of capacity the prior week, & well below the normal refinery utilization rate for mid-September, possibly due to the residual effects of tropical storm Imelda’s track through southeastern Texas…whatever the reason, the 15,656,000 barrels per day of oil that were refined this week was 3.6% less than the 16,239,000 barrels of crude per day that were being processed during the week ending October 5th, 2018, when US refineries were operating at 88.8% of capacity….
With the decrease in the amount of oil being refined, gasoline output from our refineries was a bit lower, decreasing by 15,000 barrels per day to 10,066,000 barrels per day during the week ending October 4th, after our refineries’ gasoline output had decreased by 159,000 barrels per day the prior week…but even with that decrease in gasoline output, this week’s gasoline production was 3.7% higher than the 9,711,000 barrels of gasoline that were being produced daily over the same week of last year….at the same time, our refineries’ production of distillate fuels (diesel fuel and heat oil) rose by 22,000 barrels per day to 4,835,000 barrels per day, after our distillates output had decreased by 528,000 barrels per day over the prior 3 weeks….hence, after those prior larger decreases, our distillates production was 3.8% below the 5,028,000 barrels of distillates per day that were being produced during the week ending October 5th, 2018….
Because of the decrease in our gasoline production, our supply of gasoline in storage at the end of the week decreased for the 11th time in 17 weeks and for the 25th time in thirty-two weeks, falling by 1,213,000 barrels to 228,763,000 barrels during the week to October 4th, after our gasoline supplies had decreased by 228,000 barrels over the prior week….the decrease in our gasoline supplies was larger this week because the amount of gasoline supplied to US markets increased by 223,000 barrels per day to 9,460,000 barrels per day, and because our imports of gasoline fell by 201,000 barrels per day to 642,000 barrels per day while our exports of gasoline fell by 124,000 barrels per day to 796,000 barrels per day….after this week’s decrease, our gasoline supplies were 3.1% lower than last October 5th’s inventory level of 236,172,000 barrels, and slipped back to roughly 2% above the five year average of our gasoline supplies for this time of the year…
Even with the small increase in our distillates production, our supplies of distillate fuels fell for the 18th time in the past 30 weeks, decreasing by 3,943,000 barrels to 127,324,000 barrels during the week ending October 4th, after our distillates supplies had decreased by 2,418,000 barrels over the prior week…the decrease in our distillates supplies was more extreme this week because our exports of distillates rose by 205,000 barrels per day to 1,454,000 barrels per day while our imports of distillates rose by 42,000 barrels per day to 92,000 barrels per day, and because the amount of distillates supplied to US markets, an indicator of our domestic demand, increased by 76,000 barrels per day to 4,036,000 barrels per day….after this week’s inventory decrease, our distillate supplies were 4.6% less than the 133,465,000 barrels of distillates that we had stored on October 5th, 2018, and fell to around 9% below the five year average of distillates stocks for this time of the year…
Finally, with the increase in oil production and the refinery slowdown, our commercial supplies of crude oil in storage rose for the sixth time in seventeen weeks and for the twenty-first time in 38 weeks, increasing by 2,927,000 barrels, from 422,642,000 barrels on September 27th to 425,569,000 barrels on October 4th…that increase still left our crude oil inventories near the five-year average of crude oil supplies for this time of year, but more than 25% higher than the prior 5 year (2009 – 2013) average of crude oil stocks as of the first weekend of October, with the disparity between those comparisons arising because it wasn’t until early 2015 that our oil inventories first rose above 400 million barrels…since our crude oil inventories had generally been rising over the past year up until the most recent seventeen weeks, after generally falling until then through most of the prior year and a half, our oil supplies as of October 4th were still 3.8% above the 409,951,000 barrels of oil we had stored on October 5th of 2018, but at the same time were 7.9% below the 462,216,000 barrels of oil that we had in storage on October 6th of 2017, and 10.2% below the 473,958,000 barrels of oil we had in commercial storage on October 7th of 2016…
OPEC’s Monthly Oil Market Report
Thursday of this past week saw the release of OPEC’s October Oil Market Report, which covers September OPEC & global oil data, and hence serves to give us the first snapshot of the impact that the September 14th drone attack on Saudi oil infrastructure had on their crude oil production, OPEC’s oil output, and global oil supplies….as you’ll see, this report shows there was again a large shortfall in the amount of oil produced globally in September, almost twice the large shortfall seen in August…
The first table from this monthly report that we’ll look at is from the page numbered 58 of that report (pdf page 68), and it shows oil production in thousands of barrels per day for each of the current OPEC members over the recent years, quarters and months, as the column headings indicate…for all their official production measurements, OPEC uses an average of estimates from six “secondary sources”, namely the International Energy Agency (IEA), the oil-pricing agencies Platts and Argus, the U.S. Energy Information Administration (EIA), the oil consultancy Cambridge Energy Research Associates (CERA) and the industry newsletter Petroleum Intelligence Weekly, as a means of impartially adjudicating whether their output quotas and production cuts are being met, to thus avert any potential disputes that could arise if each member reported their own figures…

As we can see from the above table of oil production data, OPEC’s oil output fell by 1,318,000 barrels per day to 28,491,000 barrels per day in September, from their revised August production total of 29,809,000 barrels per day…however that August figure was originally reported as 29,741,000 barrels per day, which means that August’s production was revised 68,000 barrels per day higher and hence September’s production was, in effect, a 1,250,000 barrel per day decrease from the previously reported production figures (for your reference, here is the table of the official August OPEC output figures as reported a month ago, before this month’s revisions)…
We can also see that the 1,280,000 barrel per day decrease in production from the Saudis, largely due to the attack on their facilities, was the reason for OPEC’s September output drop, as decreases of 82,000 barrels per day in output from Venezuela and 60,000 barrels per day in the output from Iraq were largely offset by the 104,000 barrel per day increase in output from Libya and the 24,000 barrel per day increase by Angola, while the oil output from most other OPEC members was comparatively little changed….we should note that the Saudis reported to OPEC that their production was only lower by 660,000 barrels per day, or only by half as much as the official figures….this can be seen in the the table below, also from the supply section of the report:

This table is also from the page numbered 58 of OPEC’s October Oil Market Report (pdf page 68), and it shows the oil production totals that several of the OPEC members reported directly to the OPEC Secretariat…usually, these self reported totals are pretty close to the official output totals shown in the first table we posted, but as you see here, in September there was quite a divergence between the official production totals and what several of the OPEC members reported they produced…most notable, of course, is the much smaller output decrease that the Saudis reported…one would think that sophisticated producers such as the Saudis would have a better idea what they produced than outside agencies, but the Saudis have been putting a lot of effort into minimizing the perceived effects of the attack on their output, with repeated reassurances in the media that their production quickly recovered, since they are still planning to go ahead with the IPO of Saudi Aramco, and are trying to reverse any bad publicity that would effect the eventual pricing of their stock offering…
Production from most other OPEC members, other than Iraq and Nigeria, also remains below the output allocation as originally determined for each OPEC member after their December 7th, 2018 meeting, when OPEC agreed to cut 800,000 barrels per day as part of a 1.2 million barrel per day cut agreed to with Russia and other oil producers, and which were extended at their July 1st meeting a little over three months ago…this can be seen in the table of OPEC production allocations we’ve included below:
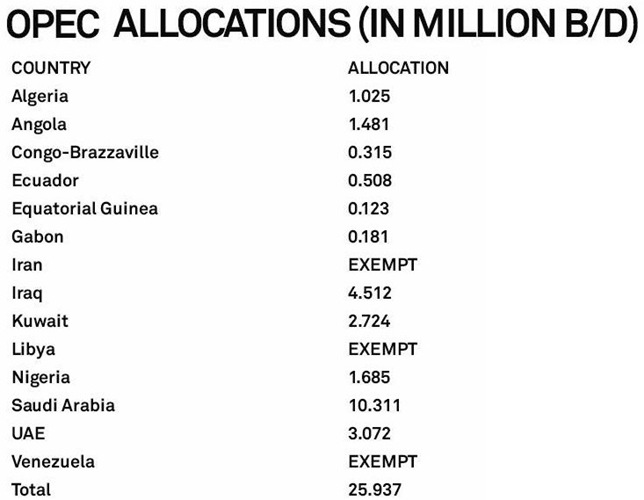
The above table came from a February 6th post on Saudi cuts and OPEC allocations at S&P Global Platts, and it shows average daily production quota in millions of barrels of oil per day for each of the OPEC members as was agreed to at their December 2018 meeting and has now been extended through March 2020 as of their recent meeting….note that Venezuela and Iran, whose oil exports are being sanctioned by the Trump administration, and Libya, which has been beset by a civil war, are exempt from any production quotas, and that only Libya among those exempt countries is producing more than they did in the 4th quarter of 2018, which you can see in the third column of the first, official OPEC production table above…we should note that there are media reports that OPEC has agreed to raise the quota for Nigeria to 1.774 million barrels per day, but there was no official policy statement to that effect…
the next graphic from the report that we’ll include shows us both OPEC and world oil production monthly on the same graph, over the period from October 2017 to September 2019, and it comes from page 59 (pdf page 69) of the September OPEC Monthly Oil Market Report….on this graph, the cerulean blue bars represent OPEC oil production in millions of barrels per day as shown on the left scale, while the purple graph represents global oil production in millions of barrels per day, with the metrics for global output shown on the right scale…

Including the 1.32 million barrels per day decrease in OPEC’s production from what they produced a month ago, their preliminary estimate now indicates that total global oil production fell by 1.77 million barrels per day to 97.32 million barrels per day in September, and that reported decrease came after August’s total global output figure was revised down by 150,000 barrels per day from the 99.24 million barrels per day global oil output that was reported a month ago, as non-OPEC oil production fell by a rounded 450,000 barrels per day in September after that revision, with lower oil production from Canada, Norway, Kazakhstan, and Russia the major reasons for the non-OPEC output decrease in September…the 97.32 million barrels per day produced globally in September was also 2.00 million barrels per day, or 2.0% lower than the revised 99.32 million barrels of oil per day that were being produced globally in September a year ago (see the October 2018 OPEC report (online pdf) for the originally reported September 2018 details)…with this month’s decrease in OPEC’s output, their September oil production of 28,491,000 barrels per day fell to 29.3% of what was produced globally during the month, down from the revised 30.1% share they contributed in August….OPEC’s September 2018 production was reported at 32,761,000 barrels per day, which means that the 13 OPEC members who were part of OPEC last year, excluding Qatar from last year’s total and new member Congo from this year’s, produced 3,989,000 fewer barrels per day of oil than they produced a year ago, when they accounted for 33.1% of global output, with a 1,948,000 barrel per day drop in output from Saudi Arabia, a 1,288,000 barrel per day decrease in the output from Iran, and a 553,000 barrel per day decrease in the output from Venezuela from that time more than offsetting the small year over year production increases of 111,000 barrels per day by Nigeria, 111,000 barrels per day by Libya, 78,000 barrels per day by the United Arab Emirates and 74,000 barrels per day by Iraq…
With the 1,770,000 barrels per day decrease in global oil output that was seen during September, there was a substantial shortfall in the amount of oil being produced globally during the month, as this next table from the OPEC report will show us…

The table above came from page 32 of the October OPEC Monthly Oil Market Report (pdf page 42), and it shows regional and total oil demand in millions of barrels per day for 2018 in the first column, and OPEC’s estimate of oil demand by region and globally quarterly over 2019 over the rest of the table…on the “Total world” line in the fourth column, we’ve circled in blue the figure that’s relevant for September, which is their revised estimate of global oil demand during the third quarter of 2019…
OPEC has estimated that during the 3rd quarter of this year, all oil consuming regions of the globe have been using 100.70 million barrels of oil per day, which was revised from their estimate of 100.63 million barrels of oil per day for the 3rd quarter a month ago….meanwhile, as OPEC showed us in the oil supply section of this report and the summary supply graph above, OPEC and the rest of the world’s oil producers were only producing 97.32 million barrels per day during September, which means that there was a shortage of around 3,380,000 barrels per day in global oil production when compared to the demand estimated for the month…
In addition, the downward revision of 150,000 barrels per day to August’s global output that’s implied in this report, combined with the 70,000 barrel per day upward revision to 3rd quarter demand, means that the 1,450,000 barrel per day shortfall that we had originally figured for August based on last month’s figures would now have to be revised to a deficit of 1,670,000 barrels per day…similarly, the 70,000 barrel per day upward revision to 3rd quarter demand means that the 2,220,000 barrel per day shortfall that we had originally figured for July would have to be revised to a deficit of 2,290,000 barrels per day….thus, the oil supply deficit for the 3rd quarter as a whole has averaged nearly 2,440,000 barrels per day…
However, demand figures for both the first quarter and 2nd quarter were also revised lower with this report, as you can see encircled by the green ellipse on the table above…the 150,000 barrels per day downward revision to 2nd quarter demand would mean that we’d have to revise our global oil deficit for June from 620,000 barrels per day to 470,000, that we’d have to revise our May deficit from 990,000 barrels per day to 840,000 barrels per day, and we’d have to revise our global oil deficit for April from 860,000 barrels per day to 710,000 barrels per day…hence, for the 2nd quarter as a whole, even after those downward revision to demand, the world’s oil producers were producing 617,000 barrels per day less than what was needed…
Encircled in green is also a downward revision of 100,000 barrels per day to first quarter demand, a period when supply exceeded demand….that means that the global oil surplus of 190,000 barrels per day we had previously figured for March would have to be revised to a global oil surplus of 290,000 barrels per day…similarly, the 640,000 barrel per day global oil output surplus we had for February would now be a 740,000 barrel per day global oil output surplus, and the 550,000 barrel per day global oil output surplus we had for January would be revised to a 650,000 barrel per day oil output surplus.. so as you can see, we have gone from a global oil surplus averaging over 550,000 barrels per day in the first quarter to an oil shortage of 2,440,000 barrels per day by the third quarter, a swing of 3 million barrels per day….however, most of the media, including industry websites, is still reporting as if we still have a global glut of oil…
This Week’s Rig Count
The US rig count rose for the first time in 8 weeks and for the 4th time in 34 weeks over the week ending October 11th, but is still down by nearly 21% since the beginning of this year….Baker Hughes reported that the total count of rotary rigs running in the US rose by 1 rig to 856 rigs this past week, which was still down by 193 rigs from the 1063 rigs that were in use as of the October 12th report of 2018, and well less than half of the shale era high of 1929 drilling rigs that were deployed on November 21st of 2014, the week before OPEC began an attempt to flood the global oil market…
The count of rigs drilling for oil increased by 2 rigs to 710 rigs this week, which was still 157 fewer oil rigs than were running a year ago, and quite a bit below the recent high of 1609 rigs that were drilling for oil on October 10th, 2014…at the same time, the number of drilling rigs targeting natural gas bearing formations fell by 1 rig to 143 natural gas rigs, a 32 month low for gas rig drilling activity and down by 50 rigs from the 193 natural gas rigs that were drilling a year ago, and way down from the modern era high of 1,606 rigs targeting natural gas that were deployed on September 7th, 2008…in addition, a vertical rig classified as miscellaneous continued to drill on the big island of Hawaii this week, which is equal to the “miscellaneous” rig count of a year ago..
Gulf of Mexico offshore drilling activity was increased by 1 rig to 23 Gulf rigs running this week, with all of those drilling offshore from Louisiana… that’s one more rig than the Gulf of Mexico rig count of a year ago, when 21 rigs were drilling in Louisiana waters and one was drilling offshore from Texas…in addition to the Gulf, one rig continues to drill offshore from the Kenai Peninsula in Alaska, which matches the offshore Alaska count of a year ago…hence, the national total of 24 offshore rigs is up by 1 rig from the 23 rigs that were deployed offshore a year ago…
The count of active horizontal drilling rigs was up by 1 rig to 750 horizontal rigs this week, which was still 177 fewer horizontal rigs than the 927 horizontal rigs that were in use in the US on October 12th of last year, and also well down from the record of 1372 horizontal rigs that were deployed on November 21st of 2014…likewise, the directional rig count was up by 1 to 55 directional rigs this week, but those were still down by 15 from the 70 directional rigs that were operating during the same week of last year…on the other hand, the vertical rig count decreased by 1 to 51 vertical rigs this week, and those were also down by 15 from the 66 vertical rigs that were in use on October 5th of 2018…
The details on this week’s changes in drilling activity by state and by major shale basin are included in our screenshot below of that part of the rig count summary pdf from Baker Hughes that shows those changes…the first table below shows weekly and year over year rig count changes for the major oil & gas producing states, and the table below that shows the weekly and year over year rig count changes for the major US geological oil and gas basins…in both tables, the first column shows the active rig count as of October 11th, the second column shows the change in the number of working rigs between last week’s count (October 4th) and this week’s (October 11th) count, the third column shows last week’s October 4th active rig count, the 4th column shows the change between the number of rigs running on Friday and the number running before the equivalent weekend of a year ago, and the 5th column shows the number of rigs that were drilling at the end of that reporting week a year ago, which in this week’s case was the 12th of October, 2018…

As you can see, rig activity managed its first increase in eight weeks on the back of that six rig increase in the Permian basin, which is currently being targeted for oil…in the Texas Permian in the western part of the state, 4 rigs were added in Texas Oil District 8, or the core Permian Delaware, 2 rigs were added in Texas Oil District 8A, or the northern Permian Midland, and another rig was added in Texas Oil District 7C, which corresponds to southern Permian Midland…hence, with the Texas Permian seeing a 7 rig increase, it’s clear that the rig pulled out of New Mexico this week had been operating in the western reaches of the Permian Midland…those oil rig increases were offset by the 3 oil rigs pulled out of the Cana Woodford in Oklahoma, and an oil rig in another basin not tracked separately by Baker Hughes…among rigs drilling for natural gas, this week saw two rigs added in the Haynesville (one in northwest Louisiana and the other in Texas Oil District 6) and three rigs added in West Virginia’s Marcellus, while four natural gas rigs were shut down in Pennsylvania’s Marcellus, another was shut down in Ohio’s Utica, and one more was pulled from offshore of the Kenai Peninsula in Alaska, where they had been targeting natural gas at a depth of more than 15,000 feet…
ODNR Issues 10 Permits in Utica-Point Pleasant Shale – – The Ohio Department of Natural Gas issued 10 permits for horizontal drilling in the Utica-Point Pleasant shale last week. Half were awarded to Antero Resources Corp. for wells in Seneca Township in Noble County. Three were awarded to Equinor USA Onshore Properties Inc. for sites in Salem Township in Monroe County. And two were granted to EAP Ohio LLC for wells in the German Township, Harrison County. As of Oct. 5, the ODNR had issued 3,177 permits for horizontal drilling in the shale play, with 2,707 wells being drilled. Of those, 2,339 are active. No permits were awarded in Mahoning, Trumbull or Columbiana counties. Nor were any permits issued in Mercer or Lawrence counties in Pennsylvania, according to the state’s Department of Environmental Protection.
Report: Ohio Counties Have Received Nearly $142 Million in Real Estate Property Taxes from Utica Shale Production – Eight of Ohio’s top Utica Shale development counties collected more than $141.9 million in real estate property taxes on oil and natural gas production since 2010, according to an updated report by Energy In Depth and the Ohio Oil and Gas Association.The Utica Shale Local Support Series report entitled, “2019 Update: Ohio’s Oil and Gas Industry Property Tax Payments,” analyzes the economic impacts of oil and natural gas real estate property (or ad valorem) taxes paid in these counties from 2010-2017: Belmont, Carroll, Columbiana, Guernsey, Harrison, Jefferson, Monroeand Noble.Data was collected through Freedom of Information Act requests, and builds on EID and OOGA’s previous 2017 reports on real estate property taxes and road use management agreements.The Utica Shale Local Support Series shows the real dollars being paid to Ohio’s communities. As Harrison Hills Superintendent Dana Snider said: “Harrison Hills has experienced a great working and supportive relationship with the oil and gas industry. Part of that support comes from the ad valorem tax, which in large part comes to the district. Those dollars have allowed us to reinvest in our students, staff and facilities to provide a state of the art, nurturing and creative learning environment that our community is proud of.” Here are the key findings of the 2019 updated report:
Pipeline protection bill stomps on civil rights – Columbus Dispatch – You’d think the oil and gas industry would be satisfied, now that it has pushed all of its measly opposition aside, crisscrossed Ohio with pipelines and fracked up the countryside with its well pads. But no, there are still citizens to be muzzled. Senate Bill 33 has been oozing its way around the Statehouse for months. It passed the Senate in May and now resides in the House Public Utilities Committee. It aims to bolster laws already on the books by tailoring them to specifically address “critical infrastructure facilities” and to target interlopers at those facilities with enhanced penalties.Critical infrastructure, according to the bill, includes everything from water plants to telecommunications towers. But it is the gas and oil industry that is driving legislation like SB 33 across the U.S. Since high-profile protests of the Dakota Access crude oil pipeline in 2016, the industry’s full-court press is working; nine states have increased criminal penalties by drafting legislation very much like SB 33. If SB 33 were to become law, it would be a first-degree misdemeanor to “knowingly enter or remain on a critical infrastructure facility,” a crime that is punishable by up to six months in jail and a $1,000 fine. If violators “knowingly destroy or improperly tamper with a critical infrastructure facility,” they would face a third-degree felony punishable by up to three years in prison and a $10,000 fine. That’s the same punishment faced by a felon caught carrying a gun. And in what would have the most chilling effect on free speech if SB 33 becomes law, organizations that are deemed “complicit” with any acts of destruction or tampering could face a fine of as much as $100,000. That might be chump change to a natural-gas pipeline operator, but it could be a lethal blow to a local grassroots environmental group.”This is designed to discourage protest,” Gary Daniels, chief lobbyist for the American Civil Liberties Union of Ohio, told Dispatch Reporter Marty Schladen last week. The wording of SB 33 is as murky as that gray sludge the pipeline companies spilled all over the landscape back when they were assembling their lines with all the care of a sugar-addled toddler cramming and jamming his way through a bucket of giant Legos. Is it tampering to block a driveway to a well pad? To hang a protest banner on a section of pipeline, or to simply stick a sign in the ground? Is it tampering to scuff your boots in the dust of a pipeline right of way when the industry doesn’t particularly like what you’re saying through that megaphone of yours?
Clean-up process begins at former injection well site in Alex Township – Athens NEWS – A state-ordered clean-up of an oilfield waste disposal site in Alexander Township is under way, a spokesperson for the Ohio Department of Natural Resources’ Division of Oil & Gas Management confirmed on Friday.”Vac (vacuum) trucks are in the process of that clean-out,” Adam Schroeder confirmed in an email Friday morning. “They’re moving along, and our inspector is watching and making sure it’s done to the letter of the law.”This past summer, the ODNR oil and gas division ordered operators of temporary injection-well storage pits to take steps toward draining them of residual oilfield and fracking wastes, properly disposing of the “technologically enhanced naturally occurring radioactive material” in the pits, and ensuring the pits’ physical integrity going forward. One of these “concrete pits constructed below ground surface for temporary storage of saltwater and oilfield wastes” is the Ginsberg well, an open-air cement storage pit located a stone’s throw away from Ladd Ridge Road in Athens County’s Alexander Township. The NEWS was alerted to the clean-up process last week after receiving word from a neighbor who reported seeing renewed truck traffic going to and fro the Ginsberg site. After the ODNR Oil & Gas division’s order in July, a news release from the Athens County Future Action Network (ACFAN, sometimes using the term “Fracking Action Network”) appeared to applaud the move toward stronger regulation of the temporary storage pits such as the Ginsberg well, with the release’s headline declaring “Constant Pressure Constantly Applied Finally Made a Difference.” However, in the same release, Roxanne Groff, a member of ACFAN, cautioned that “final victory” won’t happen “until these pits and wells are closed.” She added, “Drilling holes and injecting toxic radioactive waste in our ground must stop. We hope that this long overdue ODNR mandate will result in operators shutting down their dangerous waste dumps.” ODNR’s Schroeder said Friday that the clean-up of the Ginsberg well, during which waste material is sucked out of the temporary storage pits, “is progressing well” and should be completed in a matter of weeks, providing the weather doesn’t interfere. (That was before the heavy rain earlier this week.) Asked Monday morning where the waste material will be taken, Schroeder responded, “The waste will be taken to an approved facility, Austin Masters Services in this case, where it will be processed and solidified before being sent to a landfill. The division (or Oil and Gas Resource Management) will receive a manifest of these activities once they occur.”
Utica Summit hears Shell cracker update – Thousands of workers continue to build Shell’s new petrochemical plant in western Pennsylvania. When completed, the plant will turn ethane gas produced by Utica and Marcellus shale wells into plastic pellets used in everything from packaging films to hardhats. Michael Marr, business integration lead for Shell Appalachia, said workers had finished erecting major parts of the plant, but some 6,000 electricians, pipefitters and welders would be there for the foreseeable future connecting the pieces. Marr declined to give a more precise completion date. Shell is the first company to start building a cracker in the region. Thailand-based PTT Global Chemical is exploring a similar project in Belmont County. Charles Zelek, senior economist for the U.S. Department of Energy’s Office of Fossil Energy, said the Appalachian Basin isn’t getting the most value from its ethane. In January, the region sent some 900,000 barrels of ethane per day into natural gas pipelines to be burned as fuel – enough to supply 10 multi-billion-dollar crackers, Zelek said, citing data from the U.S. Energy Information Administration. Another 250,000 barrels of ethane per day will be exported from the region this year, he said. But for the Appalachian Basin to support more cracker plants, it has to have large-scale storage facilities. Several have been proposed, but none have been built, Zelek said. The Shell cracker is supplied by a system of pipelines that act as virtual storage. Cracker capacity is projected to grow over the next decade, with $227 billion worth of projects up for grabs. The Appalachian Basin is competing with the Gulf Coast and Canada for those projects, and will need to have crackers in place by 2030 to capture that market, Zelek said. Because it takes seven to 10 years to design and build a cracker, “we need to be starting on new facilities sooner than later to beat the market,” he said.
Report: Amount of Marcellus, Utica natural gas higher than in 2011 – The amount of recoverable natural gas in the Marcellus and Utica shale formations in the Appalachian Basin is significantly greater than previously thought, according to a new estimate by the U.S. Geological Survey. The USGS said in its latest assessment that the shale formations, both of which cover Western Pennsylvania, contain an estimated mean of 214 trillion cubic feet of “undiscovered, technically recoverable continuous resources of natural gas.”The 2019 estimate represents a significant increase from previous USGS assessments of both shale formations. In 2011, the USGS estimated a mean of 84 trillion cubic feet of natural gas in the Marcellus shale, and in 2012 the USGS estimated about 38 trillion cubic feet of natural gas in the Utica shale. Advancements in drilling techniques and new geological knowledge account for the increased estimates, USGS said.”Since our assessments in 2011 and 2012, industry has improved upon their development techniques for continuous resources like the shale gas in the Appalachian Basin,” said Walter Guidroz, program coordinator for the USGS Energy Resources Program. “That technological advancement, plus all of the geological information we’ve gained from the last several years of production, have allowed us to greatly expand our understanding of these formations.”The natural gas is defined as continuous because, in both formations, it is spread throughout the assessed rock layers instead of being concentrated in discrete accumulations, USGS said. Production techniques like directional drilling and hydraulic fracturing, or fracking, are required to produce these resources. The USGS assessments are for “undiscovered, technically recoverable resources,” meaning they have been estimated to exist based on geology and other data, and they can be produced using current standard industry practices and technology.
USGS: Appalachian Formations Hold Estimated 214 Tcf of Gas – Journal of Petroleum Technology – The Marcellus Shale and Point Pleasant-Utica Shale formations of the Appalachian Basin hold an estimated mean of 214 Tcf of undiscovered, technically recoverable continuous resources of natural gas, according to an updated assessment from the US Geological Survey (USGS). The Marcellus, Point Pleasant, and Utica extend into parts of Kentucky, Maryland, New York, Ohio, Pennsylvania, Virginia, and West Virginia. USGS assessments are for remaining resources and exclude known and produced oil and gas. The new numbers – about 97 Tcf of gas for the Marcellus and 117 Tcf of gas for the Utica-Point Pleasant – represent large increases from previous USGS assessments of both formations. In 2011, the USGS estimated a mean of 84 Tcf in the Marcellus, and in 2012 the agency estimated about 38 Tcf in the Utica. Seeing the USGC estimates for the Marcellus rise from 2 Tcf to almost 100 Tcf in less than 20 years shows “the effects American ingenuity and new technology can have,” said USGS Director Jim Reilly. The Marcellus also holds an estimated 1.5 billion bbl of natural gas liquids (NGLs), while the Point Pleasant-Utica also has an estimated 1.8 billion bbl of oil and 985 million bbl of NGLs, according to the USGC estimates. Undiscovered resources are those that have been estimated to exist based on geology and other data but have not yet been proven to exist by drilling or other means. Technically recoverable resources, meanwhile, are those that can be produced using today’s standard industry practices and technology. This is different from reserves, which are quantities of oil and gas that are currently profitable to produce. The latest assessment of the Marcellus can be found here.
Pennsylvania Cancer Patients: They Were Fracking Directly Across From School – – Former Pennsylvania elementary school classmates Nicole Stewart and Grace Lipscomb were shocked when they learned that they had both been diagnosed with the same rare childhood cancer. Stewart, now 19, found out that she had Hodgkin’s lymphoma at age 16. After finishing chemotherapy, she heard that her former grade-school classmate Lipscomb, also now 19, had just been diagnosed with the same extremely rare disease. Because only about 8,000 cases of Hodgkin’s are diagnosed in the United States each year, both girls found it odd that cancer could afflict two kids at the Fort Cherry Elementary School in the small town of McDonald, Pennsylvania, which has a population of only around 2,000 people Stewart and Lipscomb are not alone. Since 2008, at least 67 cases of childhood cancers, many of them rare, have been documented in their home county of Washington and the neighbouring counties of Greene, Fayette and Westmoreland.Such uncanny coincidences have led many residents of these rural communities to question whether something in the environment is making children sick. Many residents of their town and nearby rural communities southwest of Pittsburgh are concerned that the fracking industry, which has exploded in the area since 2008, could be causing such illnesses. Lipscomb was told she had Hodgkin’s just two years after her own mother had been diagnosed with a rare, non-genetic breast cancer. “It’s all happening in the same school district. There’s also a lot of people who have asthma in our school district too”, she said. Hydraulic fracturing is a highly volatile process in which a toxic mix of chemicals is injected at high pressure into the earth to break up rocks and extract the natural gas trapped inside. The process produces waste that includes multiple substances that are known to be harmful to human health, including benzene, toluene, xylene and ethylbenzene. Washington County now has nearly 1,200 active fracking wells, and production here has helped transform Pennsylvania into the nation’s No. 2 natural gas state. But Pennsylvania’s Department of Environmental Protection has documented more than 4,000 fracking violations in Washington County, including failure to properly dispose of residual waste and pollution, hazardous well venting and pollution of local waters with toxic substances.
Canon-Mac parents want deeper investigation of suspected childhood cancer cluster – Holding the funeral-home portrait of her son Curtis who died in 2011 from Ewing’s sarcoma, Cindy Valent came to a hearing Monday night about the suspected cancer cluster in Washington County with a direct request: Find out why so many youth in southwestern Pennsylvania have contracted the rare and deadly form of cancer, and whether it has anything to do with the natural gas industry. Valent, who now lives in Beaver County, used to live in Cecil less than a mile from two other youth with Ewing’s. Curtis Valent was diagnosed in 2008 with the form of bone cancer. He died at age 23 on Jan. 1, 2011, soon to graduate from Robert Morris University and recently engaged. “They’ve got to do an investigational study of all these kids that had it to find out what they have in common,” Valent said of the recent rise in Ewing’s sarcoma that led the Pennsylvania Department of Health to investigate whether there’s been a definable cluster of Ewing’s and other cancers in Washington and Westmoreland counties. The Health Department study found that there wasn’t a definable cancer cluster nor a significant rise in the number of childhood cancers at Canon-Mac or in the region. There have reportedly been six cases of Ewing’s in the Canon-McMillan School District since 2008. Valent and a number of other parents, including family members of others with Ewing’s, say they want to know whether the drilling of natural gas wells and hydraulic fracturing have had an impact. They spoke out at a hearing Monday night at Canon-McMillan High School that featured two Department of Health officials and a UPMC researcher, questioning the study’s methodology, whether all cases were accounted for in the study, and also the fact that environmental factors weren’t taken into account in the investigation. The causes of Ewing’s remain unknown. Janice Blanock and Kurt Blanock lost their 19-year-old son,Luke Blanock, three years after being diagnosed with Ewing’s. Janice Blanock urged Gov. Tom Wolf and the Pennsylvania Department of Health to dig deeper. “We don’t know what caused our son’s cancer. However, taking into consideration the high number of rare cancers in Washington, Greene, Westmoreland and Fayette counties … It should seem obvious to anyone with an ounce of common sense, sincere heartfelt concerns, and true courage that we need to be looking at environmental issues and triggers,” Janice Blanocksaid.Luke Blanock‘s sister, Carla Marratto, expressed concern that drilling and hydraulic fracturing could be a factor. “What came into this area that boomed, right before that,” Marratto said. “No one was going to say it anyone’s speech. No one’s going to say it … This area was polluted by fracking.”
State suspends gas driller’s license for failure to pay impact fees – Pennsylvania suspended a Texas energy company’s license to operate two Somerset County gas wells because it has failed to pay almost $95,000 in impact fees and related costs for 2014, 2015 and 2016. The state Department of Environmental Protection on Wednesday ordered Xtreme Energy Co. of Victoria to cease operations immediately on its two wells – Hillegas and Menhorn – located south of Somerset in Brothers Valley Township. The suspension will remain in effect until the impact fees and penalties are paid, the state said. This is the first time the department ordered a gas well owner to cease operations over not paying the impact fees, said Lauren Fraley, a spokeswoman for the DEP in Pittsburgh. The state distributed almost $252 million in impact fees in 2018, according to the Pennsylvania Public Utility Commission, which collects the fees. The impact fees, distributed to state, local and county governments, are determined on a multi-year fee schedule based on the average price of natural gas, according to state Act 13 which authorized the fees. “They (municipalities) rely on those fees,” Fraley said. The PUC recommended to DEP on Sept. 10 that it withdraw Xtreme Energy’s permit to operate those two wells. The PUC’s enforcement and investigation bureau had investigated the matter, dating back to April 2017. Xtreme Energy had agreed in a May 2019 settlement with the PUC to pay $94,684 by July 17. Xtreme did not pay the fees nor did it appeal a June 17 order requiring the payment, the PUC said.
Pennsylvania Senator Daylin Leach Proposes Constitutional Amendment To Ban Fracking – (KDKA) – A Pennsylvania senator says the damage caused by fracking outweighs any economic benefit. Fracking for natural gas in the Marcellus shale has been a source of jobs and dollars for many in Southwest Pennsylvania. Pennsylvania State Sen. Daylin Leach, a Philadelphia Democrat, is proposing a constitutional amendment to ban fracking throughout the commonwealth after a visit to this area. He said toured Washington County fracking sites, met with people who live near those sites and heard their stories. “At the end of the day, we want industry to do well,” Leach told KDKA money editor Jon Delano on Thursday. “But that can’t be our top priority. We can’t do that at the expense of people’s health.” Leach cites cases of cancer, skin and respiratory problems, and even dead animals. But the president of the Marcellus Shale Coalition disputes those claims. “The Department of Health has studied and will continue to study it. To date, they’ve not found a single link that would provide validity to that kind of report or that kind of a statement,” said Dave Spigelmyer. Spigelmyer says the abundant natural gas here has reduced home gas bills by 70 percent. “We’ve got incredible job growth in our commonwealth,” Spigelmyer said. Spigelmyer says this constitutional amendment is short-sighted and has broad implications. “You not only kill the natural gas industry, you kill the oil industry as well,” Spigelmyer said.
Gas drillers, owner of pipeline that exploded in Beaver County stuck together, even as they spar – Hours after Energy Transfer’s new Revolution pipeline slid down a steep Beaver County hillside and exploded – bringing sudden daylight to a Center Township neighborhood before sunrise on Sept. 10, 2018 – the company drafted two letters. Energy Transfer’s senior vice president for business development signed his name and sent copies of each to its clients, PennEnergy Resources LLC and EdgeMarc Energy Holdings LLC. The first letter announced that Revolution, a 40.5-mile natural gas gathering pipeline, had begun commercial operations on Sept. 9, thereby satisfying the deadlines set in the company’s contracts with the drillers. The second said that commercial operations on the pipeline had been suspended by what in legal terms translates to an “act of God,” an event outside of the company’s control. Neither of those things made sense to Greg Muse, PennEnergy’s COO, whose Moon-based company was awaiting the start of the Revolution pipeline service to ferry gas from wells in Beaver and Butler counties. Two days later, he told the pipeline firm that he disagreed with each premise. This kicked off a year of negotiations with Texas-based Energy Transfer, whose inability to stabilize the ground after the Beaver County explosion prompted environmental regulators to suspend the review of all new and pending permits. The 24-inch-wide Revolution pipeline remains out of commission with no timeline for a restart. As PennEnergy tried to work things out with Energy Transfer behind the scenes, the case against the pipeline firm was being built in different corners of the state. Pennsylvania environmental regulators were conducting discovery in two cases dealing with the Revolution pipeline. The Pennsylvania attorney general’s office launched an investigation into the explosion, the scope of which is “unknown,” Energy Transfer disclosed to investors in August. And Canonsburg-based EdgeMarc filed for bankruptcy – citing the Revolution explosion and Energy Transfer’s treatment of it as the precipitating event. Proving that the letters Energy Transfer had sent on the day of the explosion were false quickly became the centerpiece of EdgeMarc’s bankruptcy proceedings. Now PennEnergy has joined the fray. It filed a lawsuit asking a judge to declare, once and for all, that Energy Transfer hadn’t in fact placed the new pipeline into commercial operations and that the damage to the pipeline lays at the hands of the company. “The explosion was not an ‘act of God,'” PennEnergy’s complaint, filed in the Court of Common Please of Allegheny County, asks a judge to declare. “The explosion occurred in an area where the pipeline was constructed on a dangerously steep slope, which was a known landslide area, when fill material that [Energy Transfer] had placed on top of its pipeline slid, causing a landslide that ruptured the pipeline – all circumstances within ETC’s reasonable control.”
Hellbenders have their day in court – Six years after a plan for a drilling waste-disposal injection well was first revealed in northern Indiana County and after area residents banded together against it, lawyers waged another battle Friday in Pennsylvania Commonwealth Court. The dispute centers now on whether a home rule form of government passes Constitutional muster and empowers Grant Township to prohibit the dumping of fracking waste in its environment. Pennsylvania Department of Environmental Protection sued the community of 700 people in 2017 and after two years of trading arguments on paper – a case log that now extends 11 pages – attorneys argued their points in a 17-minute hearing at the state’s courtroom in Pittsburgh. Lawyer Rick Watling asked the judges to rule that the ban on oil and gas waste fluid disposal in Grant’s Home Rule Charter is unlawful because Grant only has police powers to limit land uses through its zoning powers (under the Municipalities Planning Code). The DEP’s position is that its guiding laws, in this case the state Gas and Oil Act, have the upper hand over regulations imposed at the local level. Watling asked the judges to dismiss the township’s counter claims in the case. Karen Hoffman, a Philadelphia-based attorney representing Grant Township and its board of supervisors, argues that home rule invokes state statues as its basis of authority. Pennsylvania General Energy (PGE) prevailed late last year in a federal lawsuit charging that the township violated the company’s civil rights when it enacted a “community bill of rights” ordinance that included a ban on injection wells. Township residents including an environmental protection group, the East Run Hellbenders Society, have warred against the uncertain integrity of a depleted former natural gas well as a vessel for holding the waste from other drilling operations. Without a guarantee that injected waste wouldn’t leak into underground water supplies that feed the residents’ drinking water walls, and into the surface water streams known as favorite for fishermen in the region, the township has taken up the expense of a legal fight to protect its irreplaceable resources.
Courts Question Pipeline Builders’ Use of Eminent Domain to Take Land – A recent federal court ruling could give states more authority to oppose natural gas pipeline projects by limiting the controversial use of eminent domain – the mandatory sale of private or state-owned land for public use. That ruling and two others involving eminent domain come amid growing opposition to pipeline projects, whose benefits to the public and risks to the environment and climate are increasingly being questioned. As the Trump administration tries to clear the way for more fossil fuel pipeline construction, a diverse coalition of environmental advocates and landowners are gaining traction in their efforts to fight new pipeline projects by focusing on property rights. They argue that pipeline developers should not be allowed to take land through eminent domain because the developers are private companies and the shipment of oil or gas shouldn’t be considered a public use or benefit. The most significant of the recent rulings involves the question of whether a state can be forced to sell state-owned land to a private company for a proposed pipeline. The case involves New Jersey and the PennEast pipeline, which would transport natural gas from the Marcellus shale region of Pennsylvania.In January 2018, the Federal Energy Regulatory Commission (FERC) determined the PennEast project would serve the public interest and approved it. New Jersey Attorney General Gurbir Grewal challenged the decision and later joined six other attorneys general in urging the commission to consider the climate impacts of new pipelines as part of the certification process. The proposed route for the PennEast pipeline would cross two parcels of state-owned land in New Jersey. When the state refused to grant easements for the pipeline, PennEast sued to try to take the land under the power of eminent domain. In its lawsuit, PennEast argued that allowing New Jersey to deny the sale of state land “would leave states with unchecked veto power over interstate natural gas pipeline projects.” A federal appeals court sided with the state, ruling on Sept. 10 that PennEast cannot force the sale of state-owned land on the grounds that private parties cannot sue states in federal court. The judges wrote that their determination applies not only to two parcels of land that the state owns outright, but also to 40 additional parcels of land where the landowner has an “easement” agreement with the state to preserve the land for recreational, conservation or agricultural use.
U.S. Supreme Court takes up fight over $7.5 billion natural gas pipeline – (Reuters) – The U.S. Supreme Court on Friday agreed to hear an appeal by Dominion Energy Inc and President Donald Trump’s administration of a lower court ruling that halted construction on a $7.5 billion natural gas pipeline due to run underneath a section of the popular Appalachian Trail in rural Virginia. The administration and companies involved in the project have asked the justices to overturn a ruling that found that the U.S. Forest Service lacked the authority to grant a right of way for the pipeline. Environmental groups had sued to stop the pipeline after the Forest Service gave the green light for the project through protected National Park Service land. The December 2018 ruling by the Richmond, Virginia-based 4th U.S. Circuit Court of Appeals put a stop to construction of the 600-mile (965-km) Atlantic Coast Pipeline, intended to run from West Virginia to North Carolina. Dominion Energy leads a consortium of companies in the project that also includes Duke Energy Corp. At issue is the Forest Service’s decision to allow the pipeline to cross underneath the 2,200-mile (3,500 km) long Appalachian Trail – a popular hiking route in the eastern United States stretching from Georgia to Maine – in the George Washington National Forest. “The Supreme Court’s acceptance of our petition is a very encouraging sign and provides a clear path forward to resolve this important issue,” said Aaron Ruby, a Dominion spokesman.
Supreme Court denies appeal of eminent domain for Mountain Valley Pipeline – The U.S. Supreme Court will not hear an appeal from a group of Virginia landowners whose property was taken by eminent domain for the Mountain Valley Pipeline. (Roanoke Times)
Supreme Court won’t hear cases on pipelines’ eminent domain, ban on Calif. utilities putting wildfire costs in rates – The U.S. Supreme Court has declined to hear two cases closely watched by environmentalists.The first one concerns Mountain Valley Pipeline developers’ use of eminent domain. “The high court declined to consider landowners’ plea that the builders of the 300-mile pipeline through West Virginia and Virginia should not be able to begin construction on their property without first paying ‘just compensation,’ as guaranteed under the Constitution,” Niina Farah and Pamela King report for Energy & Environment News. The second case involves whether privately owned utilities that states have held liable for wildfires can recoup damages by raising rates on their customers. “The case stems from the California Public Utilities Commission’s denial of San Diego Gas & Electric Co.’s request to recover $379 million in costs from wildfires that the company said have become the ‘new normal’ in the Golden State,” Farah and King report.
Police remove, arrest protester who attached himself to Mountain Valley Pipeline helicopter – Virginia State Police say they arrested a Mountain Valley Pipeline protester Monday morning. Police found the protester attached to a contracted pipeline helicopter at a work site on Cove Hollow Road, near Route 460 in Montgomery County, according to the Virginia State Police. Authorities removed and arrested Galen Sol Shirman-Grabowski, 24, of Tuscon, Arizona. Pipeline security found Grabowski masked and attached to the rotor mast of the helicopter by a Sleeping Dragon device, refusing to leave. There was a banner on the helicopter that said, “DOOM TO THE PIPELINE,” according to Appalachians Against Pipelines. Grabowski is the 18th “pipeline fighter” to lock his or her body to Mountain Valley Pipeline equipment in 2019, according to Appalachians Against Pipelines. Grabowski was charged with the following:
- Tamper/damage an aircraft (felony)
- Prohibition of wearing of masks in certain places (felony)
- Obstructing justice, without force (misdemeanor)
- Entering property of another for the purpose of damaging it (misdemeanor)
- Breaking, injuring, defacing, destroying or preventing the operation of vehicle, aircraft or boat (misdemeanor)
- Injuring property (misdemeanor)
Officials catch Mountain Valley Pipeline workers transporting water to seed grass during drought – A senator and delegate catch Mountain Valley Pipeline officials transporting thousands of gallons of water to seed grass during drought. Senator Stephen Baldwin and Delegate Jeff Campbell received word that Mountain Valley Pipeline was transporting thousands of gallons of water multiple times a day up the mountain to seed grass. Right now, the state of West Virginia is experiencing a drought and the State is currently in State of Emergency, due to dry grounds and low water. Industrial water usage is required to be restricted, due to the state of emergency that is in effect. Both Baldwin and Campbell contacted West Virginia State Police who visited the site today. The company told them they would not be using the limited local water any longer during this drought. Baldwin says, “When our citizens and farmers are conserving water for the common good, it’s a shame that anyone would so blatantly disrespect our communities. I want to thank the WVSP for their quick response.”
Gas-fired power projects on the rise in WV – – While the old adage says coal is king in West Virginia, natural gas is beginning to play a larger role in the state’s energy generation landscape. Plans for a significant natural gas-fired power plant project are underway in Harrison County, and Longview Power has recently announced its intention to construct a new facility housing one gas-fired and one solar-powered plant in Monongalia County. The Harrison County project, developed by ESC Harrison and Caithness Energy, will be a 625-megawatt combined-cycle facility with one combustion turbine generator connected to a heat recovery steam generator. The facility will occupy 13 acres of a planned 110-acre industrial park on a former 212-acre surface and underground mining site in the Montpellier area of Clarksburg. Construction will cost about $615 million and is estimated to be complete in 2020. ESC Harrison projects it will produce an $880 million economic impact during construction and $287 million per year thereafter. It will provide 400 construction jobs, 30 full-time plant operations jobs and about 700 jobs tied to maintaining and servicing the plant. It’s expected the plant will provide enough power for about 425,000 homes through the PJM Interconnect grid. PJM is the regional transmission organization that coordinates the movement of wholesale electricity in all or parts of 13 states and the District of Columbia. In June, developers announced they had entered into an engineering, procurement and construction services contract with Connecticut-based Gemma Power Systems. Caithness President Ross Ain said the company was chosen based on its experience with similar projects.Longview’s proposed facility, to be called the Longview Power Clean Energy Center, is planned for a piece of property near Maidsville in Monongalia County adjacent to the property of a current Longview coal-fired plant.
Duke climatologist seeks a halt on gas-fired power plants, Atlantic Coast Pipeline – One of the world’s leading climate scientists said the state’s long-range clean energy plan doesn’t go far enough to curb a potent greenhouse gas.In a letter to Gov. Roy Cooper dated Thursday, Drew Shindell, Nicholas Professor of Earth Science at Duke University, takes aim at methane, a gas more efficient than carbon dioxide at holding heat. Shindell said in the letter that the state should place a “permanent moratorium” on natural gas infrastructure in the state, including new gas plants planned by Duke Energy and the Atlantic Coast Pipeline, which the power company is developing with other partners. Natural gas is mostly methane, and it can leak when it is extracted from the ground or flows through pipes. “In addition to causing possibly irreparable climate damage, such infrastructure is likely to saddle consumers with much greater costs than would a more rapid transition to 100% renewable energy, while also causing additional harm to already vulnerable communities,” wrote Shindell, one of the scientists who helped coordinate sections of International Panel on Climate Change reports in 2013 and 2018. About two dozen former U.S. Environmental Protection Agency scientists and administrators endorsed the letter.Shindell co-wrote the letter with two former U.S. Environmental Protection Agency administrators and NC WARN, a nonprofit focused on climate change and a Duke Energy critic.
Will Virginians be able to resist the Atlantic Coast Pipeline? — When the government has seized Virginians’ land and homes in the past, communities suffered. — This week, the U.S. Supreme Court announced it will consider Dominion Energy’s much-delayed bid to construct the Atlantic Coast Pipeline, a 600-mile, $7.5 billion project that would carry natural gas from West Virginia to the East Coast. At the heart of the case is a request from Dominion to run its pipeline across the federally protected Appalachian Trail. In 2018, the U.S. Forest Service granted Dominion permission to cross the trail, but later that year, a lower court overturned the permit. If the Supreme Court decides the Forest Service acted within its jurisdiction, Dominion will be allowed to continue construction of its pipeline.Dominion Energy praised the court’s decision to hear the case, saying it now sees “a clear path forward to resolve this important issue.” The Trump administration has backed the energy giant’s efforts.Backers of projects like the pipeline frame this as a chance to get the government out of the way of private industry operating for a public good (energy independence). But for people in central Virginia, the push for a pipeline is a story of government interference, part of a century of struggle between government authorities and vulnerable populations that have been displaced from the land.ADOne of the largest land seizures in the history of the state took place in the same forest that Dominion now contests. In the late 1920s and early 1930s, the state of Virginia used eminent domain – which allows the government, or private companies in conjunction with the government, to seize land, compensate the owner and then use that land to benefit the public good – to acquire 190,000 acres in the Blue Ridge Mountains. Promising public good in the form of wilderness protection and tourism revenue, the state seized or condemned the homes and farms of about 465 families in rural Appalachia. Two thousand people were removed from land they had tended for generations. The state donated the forest to the federal government, and in 1936, the government opened Shenandoah National Park. Young men from the Civilian Conservation Corps, the New Deal work relief program, cleared the property and left the Cliser family’s belongings on the side of the road. For the descendants of those homesteaders pushed out of the hills, the sting of eviction still lingers. The pipeline has sparked resistance from environmental groups, which have emphasized that construction would require a clear-cut path as wide as a football field to slice through the protected parkland. The Southern Environmental Law Center has argued that the project “threaten[s] people’s health, endangered species, iconic landscapes, and clean water.”But the environmental arguments are entwined with the same anxieties over property rights and land use that have animated Virginians for decades. Urban and rural communities alike have their own collective memories of the encroachment of government-backed industry. Those memories are reflected in the diverse coalition that has come together to fight the pipeline.That unusual coalition is up against powerful forces: the Trump administration, a big energy company and a Supreme Court dominated by conservative justices. But for more than a century, the people of central Virginia have been battling the government over their right to control their land, farms, parks and city neighborhoods. Whatever happens in the Supreme Court this term, they’ll keep fighting.
GOP Lobbyists Behind Gas Industry ‘Empowerment Alliance’ Oppose Green New Deal – The Real News Network – Steve Horn – There is a new group in support of hydraulic fracturing (“fracking”) and in opposition to the Green New Deal – and it’s run by figures with long-held institutional ties to the Republican Party and fossil fuel industry. Called The Empowerment Alliance, it joins a few other campaigns funded by the fossil fuel industry lobbying against Green New Deal. Registered as a 501(c)(4) political action committee (PAC) and incorporated in Delaware on August 23, The Empowerment Alliance has not revealed its funders, but its Executive Director James Nathanson and its spokesman Terry Holt have ties to the upper echelon of the national Republican Party. “The American people deserve to know the consequences of radical and unachievable polices [sic] like the Green New Deal, and The Empowerment Alliance is going to advance that dialogue through the media with research and voter engagement,” said Nathanson in a press release announcing the group on September 27. Nathanson is a veteran of Republican Party politics who formerly served as the political director of the Republican National Committee and the Ohio director for the 1988 George H.W. Bush campaign. On its website, The Empowerment Alliance touts gas as a cleaner, greener fossil fuel. “Natural gas is the cleanest of fossil fuels and can be used in many ways to help reduce the emissions of pollutants into the atmosphere,” reads the site. “Burning natural gas in the place of other fossil fuels emits fewer harmful pollutants, and an increased reliance on natural gas can potentially reduce the emission of many of these most harmful pollutants. But natural gas production is a major emitter of methane, a greenhouse gas more 84 times more potent than carbon dioxide during its first 20 years in the atmosphere, and 28 times more potent over a 100 year period. According to an article about The Empowerment Alliance published by Politico, the group’s spokesman is Terry Holt, a lobbyist and former press secretary for Rep. John Boehner, who works for the firm HDMK. Holt has previously served as a spokesman for the coal industry public relations group Americans for Clean Coal Electricity (ACCCE),and also worked as the spokesman for the George W. Bush 2004 re-election campaign. From 2000-2004, Holt served as a senior advisor for the Republican National Committee, according to his LinkedIn profile. The Alliance has chosen not to disclose its funders, Holt said, out of fear of potential “eco-terrorists.” “Because of violence and trespassing and other criminal behavior, the Empowerment Alliance is going to protect its donors from that kind of risk,” he told the publication EnergyWire. “We are offering donors this protection out of the concern that we would have should they come forward and the scrutiny of some of these eco-terrorists.”
US Natural Gas Reserves Continue To Soar – Ever since the U.S. shale revolution took flight in 2008, it’s been a consistent theme: not just rising natural gas production but also rising proven natural gas reserves. In fact, over the past decade, the U.S. Department of Energy reports that our proven gas reserves have ballooned nearly 85% to almost 450 trillion cubic feet (Tcf). It’s all turned the previous pre-shale notion that reserves were dwindling and production was in permanent decline on its head.Not even the industry itself ever envisioned how fast our natural gas business would be transformed, thanks to shale. ExxonMobil CEO Lee Raymond infamously stated in 2005: “Gas production has peaked in North America.” Not quite good sir: led by shale, North American output is up 50% since then to past 105 Bcf/d, or some 30% of the global total. What’s even more amazing is that this boom in gas production and reserves has happened under a low-price environment, which typically work to hamper both. In other words, we have even more natural gas than advertised. Indeed, don’t forget that reserves are just subsets of the massive gas resource that we have. Reserves only illustrate what can be produced today under prevailing technologies and prices. As time goes along, and technologies advance and prices rise, more of the resource gets lifted into the reserve category, able to be produced today. Just like renewables, the oil and gas industry is always getting better. A shout out to my alma mater: Penn State “Researchers unearth cost-effective method for finding shale gas.”For example, the U.S. Geological Survey (USGS) last week announced that our primary production area of the Marcellus and Point Pleasant-Utica Shale plays in the Appalachian Basin contains an estimated 214 Tcf undiscovered, technically recoverable continuous resources of natural gas. What’s amazing is that the latest USGS data on Appalachia is more than 75% higher than its most recent study in 2011, which concluded that the Marcellus held 84 Tcf and the Utica 38 Tcf. This is just another example of how quickly our assessments of U.S. oil and gas fields continue to grow, as our appraisal technologies improve and our ability for E&P expands. To illustrate perfectly, nearly 25 years ago, the USGS estimated that the Bakken shale oil play in North Dakota had just 150 million barrels to produce…in total. Incredibly, however, as development has ensued, the mighty Bakken is now producing more than three times that amount…every year!
Appalachian natural gas production growth could be reaching its zenith – Amid continued tepid natural gas prices, producers in the Appalachian Basin region have begun reducing their drilling, although the lower activity has not yet slowed the pace of continued strong production from the basin. But this trend could change, as operators facing the prospect not only of “lower for longer” gas prices, but possibly weaker oil prices as well in 2020, could begin to plan for even more dramatic decreases in drilling activity in coming months. As far as production, both the Marcellus and Utica are showing somewhat similar growth trends, S&P Global Platts Analytics data shows. The Marcellus Shale has seen its production grow by about 1 Bcf/d from the start of 2019, from 23.56 Bcf/d in January to 24.54 Bcf/d October 9. In the Utica Shale play, production is just about back up to levels seen in late August before output fell off in early September. The play saw 7.12 Bcf/d of production October 9, up from 6.57 Bcf/d in early January, according to Platts Analytics. The production gains in the basin have continued even as natural gas prices in the region have tanked over the same period, with no signs of a rally occurring anytime soon. Spot prices at two of the region’s most important pricing points, Columbia Gas Appalachia and Dominion South, have declined from around $2.50/MMBtu to a little more than $1.00/MMBtu currently. The number of rigs operating in the Marcellus and Utica plays has begun to decline, although the Utica rig count decline has flattened out a bit, with the basin having the same number of rigs, 15, as in early September, Platts Analytics data shows. However, the rig count decline isn’t expected to have any meaningful impact on production trends in the near term, partially because of the ability of producers to bring into production the backlog of drilled but uncompleted wells, or DUCs, in the basin. Improved initial production rates for those wells that are brought online also appears to be driving the sustained production gains, Platts Analytics found. The continued strong production coming out of the Appalachian Basin, coupled with robust gas production in the Permian Basin, where most of the gas is produced in association with oil production, is leading to an abundant supply of gas across the continent, which in turn is helping to continue to suppress gas prices. Yet there are signs that the continued production growth in the Appalachian Basin is nearing its zenith, as earlier this year producers in the region announced they would begin to cut back on their drilling activities in the second half of the year. In announcing its Q2 results, Southwestern Energy said it planned to lower its average rig count from six rigs in the first half of the year to two rigs by the end of the third quarter. Last month, EQT announced it was laying off almost a quarter of its workforce, eliminating 196 positions and reducing the number of departments within the company from 58 to 15.
Michael Bloomberg’s $500 million plan to halt the growth of gas is ‘irresponsible,’ BP boss says – Outgoing BP Chief Executive Bob Dudley believes Michael Bloomberg’s $500 million plan to halt the building of gas-fired power plants in the U.S. is “irresponsible.” Speaking to CNBC’s Steve Sedgwick at the Oil & Money conference in London Wednesday, Dudley said: “Every scenario I look at, we cannot carpet the world with renewables fast enough.” In June, Michael Bloomberg, the former mayor of New York City, said that he would donate $500 million to a co-ordinated campaign called “Beyond Carbon.” The campaign, according to its website, is designed to get the U.S. “on the path to a 100% clean energy economy.” In doing so, it plans to prevent the growth of natural gas and close every coal-fired power plant in the U.S. In a separate speech to those in attendance at the Oil & Money conference, Dudley said that while Bloomberg’s efforts “may be well intentioned,” they were also “misguided.” “They rest on a false equivalence between gas and coal. And an assumption that an all-electric economy will emerge just as soon as we close the alternatives,” Dudley said. When asked by CNBC why he referenced Bloomberg in his speech, Dudley replied: “Because I think it is irresponsible.” “I think it means well (but) it is not going to work in so many countries.” A spokesperson for Michael Bloomberg was not immediately available for comment when contacted by CNBC Wednesday afternoon.
Natural Gas Fell Back Into The Buy Zone – Natural gas is one of the most volatile commodities that trade on the futures exchange. The range since 1990, when the energy commodity began trading on the NYMEX division of the CME, has been from a low at $1.02 to a high at $15.65 per MMBtu. The market has matured dramatically over the past three decades. Massive discoveries of natural gas reserves in the Marcellus and Utica shale regions of the US and technological advances in extracting the gas from the crust of the earth have increased the supply side of the fundamental equation. Since necessity is the mother of invention, natural gas demand has moved significantly higher at the same time. Gas has replaced coal when it comes to generating electricity in the US. At the same time, natural gas in liquid form now travels by ocean vessel around the globe, whereas it was confined to travel by pipeline in past years. The demand side of the equation has grown alongside the supply side. Increased liquidity in the natural gas market has compressed the price range. However, the price traded in a range from a high at $4.929 to a low at $2.029 per MMBtu between November 2018 and August 2019. As we move closer to the peak season for demand each day, the price was below the $2.30 per MMBtu level at the end of last week. Natural gas is back in the buy zone as the injection season will end in mid-November, and inventories will begin to decline. In early August, the price of nearby natural gas futures on the NYMEX division of the CME dropped to a low at $2.029 per MMBtu. During the injection season, when inventories were climbing, many market participants believed that the price would fall below the $2 level for the first time since 2016 and challenge the March 2016 low at $1.611 per MMBtu. However, the price never probed below the psychological level, and it took off on the upside. By mid-September, the price of the energy commodity recovered to a high at $2.71, a move of over 33.5% in six weeks. Natural gas is combustible in its physical form, and the price action reflected the characteristics of the energy commodity. The weekly chart highlights that the price fell as fast as it climbed, reaching a low at $2.207 per MMBtu last week. The move to the downside caused the price momentum and relative strength indicators to trend lower, but they remain on either side of neutral territory on the weekly chart as of Friday, October 4. The total number of open long and short positions in the natural gas futures market at 1.215 million contracts is has moved lower over the past weeks.
Odds Of Durable Early Season Cold Lessen, Sending Natural Gas Prices Lower – Various weather model runs late last week hinted at a potential pattern change to a colder regime, giving some life to natural gas prices in the wake of Thursday’s EIA report. The prompt month November contract at one point had moved nearly 20 cents off its Thursday intra-day low. But over the weekend, odds of a sustainable colder pattern took a hit, as models shifted toward a warmer pattern once again by the 20th. There is still a cold shot focused in the middle of the U.S. late this week into the early part of next week, but it is expected to lift out rather quickly. The reason for the change lies in a big shift in the projected pattern on the Pacific side of the pattern. Here is what the 12-16 day upper air forecast from the GFS-Ensemble looked like 3 days ago: natural gas commodity weather Notice the low heights (blue colors) back near the Aleutians, and a downstream warm ridge over the West, which pushes a colder trough into the eastern U.S. Now let’s look at the same model’s forecast from today, valid the same dates: natural gas commodity weather As you can see, that is a very different look compared to the prior image, with a cooler trough now in the West, which allows the East to warm back up. After a bump up in demand centered on this weekend, forecast GWDDs drop off quickly again thereafter. natural gas commodity weather This lack of durability in any colder pattern helped send natural gas prices back lower today, with the November contract closing nearly 5 cents lower on the day. natural gas commodity weather We recognize that it is still early for weather to be the primary driver of price action, but in this particular case, it is applicable, given that there has been no major change in the supply / demand balance as of yet, so it stands to reason that lower risks of cold when compared to weather models back on Friday can have a market impact.
Weaker Cash And Unimpressive Demand Keeps Pressure On Natural Gas Prices – After a couple of “up” days at the end of last week, natural gas prices declined for the second day in a row this week, with the prompt month November contract settling back under the $2.30 level today. Prices initially were slightly higher early this morning, as the overnight weather models gained some forecast demand. Here, you can see the forecast demand profile from those overnight runs compared to 24 hours earlier: One thing that sticks out is that even with the gain in demand, it remains rather unimpressive overall. We also are finally seeing cooler weather in the South, contributing to weaker daily cash prices. In our morning outlook to clients, we highlighted both the tame demand picture along with the risk of weaker cash prices, maintaining a “slightly bearish” stance, feeling like the bump in prices was not likely to last. This worked out well, as prompt month prices moved as low as $2.266, but did close off those intra-day lows. The midday weather models also gave back some of their overnight demand gains, which we had mentioned as a risk as well. Here is the 12-16 day pattern from the overnight GFS Ensemble: The midday run shifted warmer in this time frame: Now that we are closer to the time of year when weather becomes the primary factor that drives natural gas volatility, keeping up to date with potential weather changes is very important in the world of natural gas.
EIA Report Meets Expectations, But Natural Gas Prices Continue To Fall – Today’s EIA report showed an injection of 98 bcf for the week ending 10/4. This was almost dead-on our forecast. It was well within the range of the various market estimates as well, so we should expect prices to have no reaction to this report, right? Well, not exactly. While it was the market expectation, it confirms very loose supply / demand balances remain in place, as seen by looking at the last 10 weeks’ demand vs storage change. In short, we simply have too much supply. Production has returned back near its all time highs. Weather demand has been stout more often than not dating all the way back to the end of June, but has been unable to prevent large builds in natural gas storage thanks to these record supply levels. And even the weather demand is set to tail off significantly, with well below normal demand projected out in week two. Is this simply a hopeless scenario for natural gas bulls? Perhaps not, as prices around the 2.20 level in prompt month are quite low with the full winter season still to come, but the weather pattern needs to deliver some enhanced demand in the not-too-distant future in order to stimulate any buying in the commodity. In addition, the lower prices could alter the supply / demand balances enough to stop the bleeding, again, pending what happens with the upcoming season’s weather pattern.
NYMEX November natural gas inches lower after bearish storage report – The NYMEX November natural gas futures contract inched lower Thursday following the latest bearish weekly US storage report. November traded 1.6 cents lower Thursday, settling at $2.218/MMBtu, trading in a range between $2.202/MMBtu and $2.274/MMBtu. The US Energy Information Administration reported an injection of 98 Bcf into storage facilities in the week that ended


