


from the St Louis Fed
— this post is authored by Kevin Kliesen
A few key economic indicators may give some forecasters reason to think a recession is on the horizon. But when put into historical context, it seems that the economy is still expanding heading into the last half of the year.

On July 29, the Bureau of Economic Analysis (BEA) released the advance estimate for second-quarter gross domestic product (GDP). Also included in this report was the annual update to the national income accounts that resulted in revisions to the past three years of data.
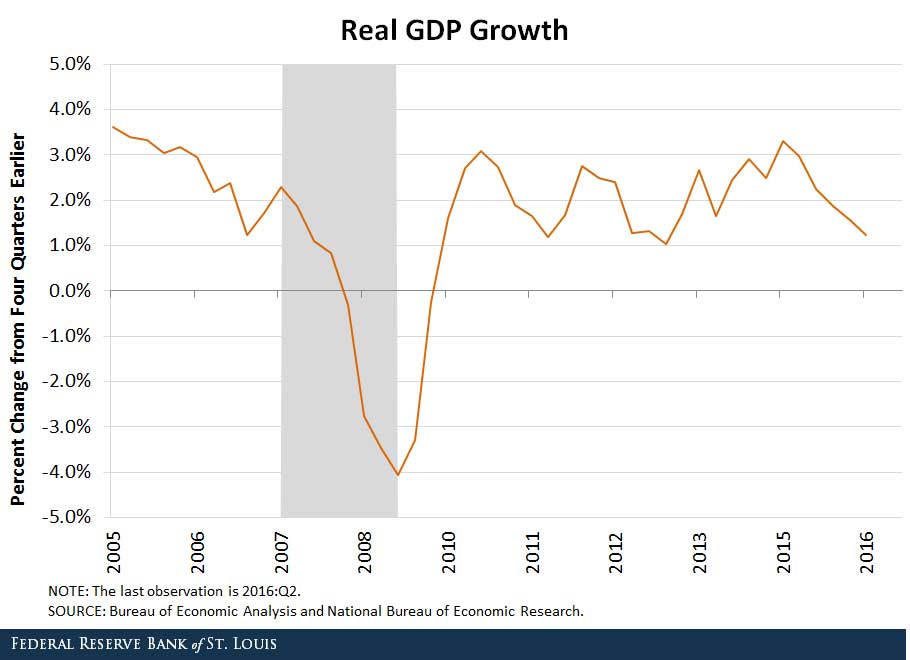
The advance estimate indicated that real GDP rose at a 1.2 percent annual rate in the second quarter.1Although the economy rebounded modestly from its anemic growth rate of 0.8 percent in the first quarter, the advance estimate was much weaker than the consensus estimate of 2.6 percent.2
Moreover, the BEA reported that real GDP growth was measurably weaker over the previous three quarters (2015:Q3 to 2016:Q1) than earlier estimates suggested. As a result, real GDP growth over the past four quarters now stands at 1.2 percent, its lowest four-quarter growth rate in three years.3
Slowing Economic Growth Rate
As seen in the figure below, the economy’s growth rate has decelerated sharply since the first quarter of 2015 (3.3 percent). Although the economy’s growth rate is barely above 1 percent, there have been episodes over the past few years when growth had also slowed sharply. Thus, this episode may be another example of a temporary slowdown, the result of periodic shocks that hit the economy. Still, it is also possible that this slowing is the leading edge of something more substantial – perhaps a recession.
The state of the business cycle plays an important role in the St. Louis Fed’s new characterization of the U.S. macroeconomic and monetary policy outlook.4 In this characterization, the economy is viewed as operating in a specific regime that tends to be persistent. These regimes could be periods of low productivity growth or business expansion or recession. And since optimal monetary policy is dependent on the regime the economy finds itself in, identifying when the economy slides into a recession is vitally important.
Recession Checkpoints
Although recessions are rarely forecastable events, economists nonetheless have a variety of checkpoints for examining the state of the economy. One checkpoint is consumer expenditures, especially on big-ticket items like autos and appliances. The outlook appears reasonably good based on this indicator: Real expenditures on durable goods rose at a robust 8.4 percent rate in the second quarter and are up nearly 4.5 percent from a year earlier.
Two other checkpoints in the national income accounts are expenditures on residential and nonresidential fixed investment. Like durable goods, a person’s decision to buy a house or a business’s decision to invest in a piece of equipment or to build a new structure depends importantly on the individual’s or the firm’s expectation of future income and earnings (and profits), respectively.
During periods of slow or slowing growth, real incomes, earnings and profits tend to slow as well. In response, firms and households typically trim their current and future expenditures. This is why fixed investment outlays are highly cyclical – that is, sensitive to the state of the business cycle.
Here is where the clouds appear a bit more ominous:
On the business side, real nonresidential fixed investment (NRFI) declined at a 2.3 percent rate in the second quarter. This was the third consecutive quarterly decline in NRFI.
On the housing side, real residential fixed investment (RFI) fell at a 6.1 percent rate in the second quarter, its largest decline in nearly six years. The decline in real RFI was somewhat unusual given the recent strength in the housing sector.
A Historical Look at Fixed Investment
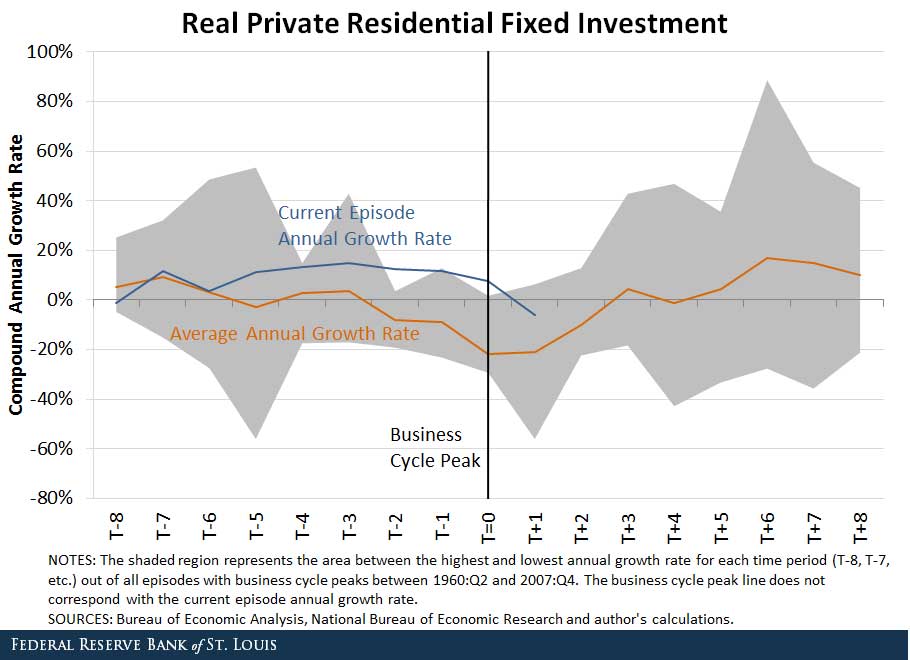
By employing the lens of history, the two figures below can help gauge whether the declines in real NRFI and RFI are likely to be temporary developments or potentially signaling the next recession.
Each figure shows the average growth rate eight quarters before and after the business cycle peak, as determined by the National Bureau of Economic Research. By definition, business expansions occur before the peak and recessions occur after the peak. Recessions are much shorter than expansions.
The average growth rates are culled from periods around the eight business cycle peaks that prevailed from the second quarter of 1960 to the fourth quarter of 2007. In the figures, the average growth before and after the recession is indicated by the orange line. The shaded areas indicate the range of values before and after the business cycle peak. The blue line shows the growth rate of each series from the first quarter of 2014 to the second quarter of 2016.
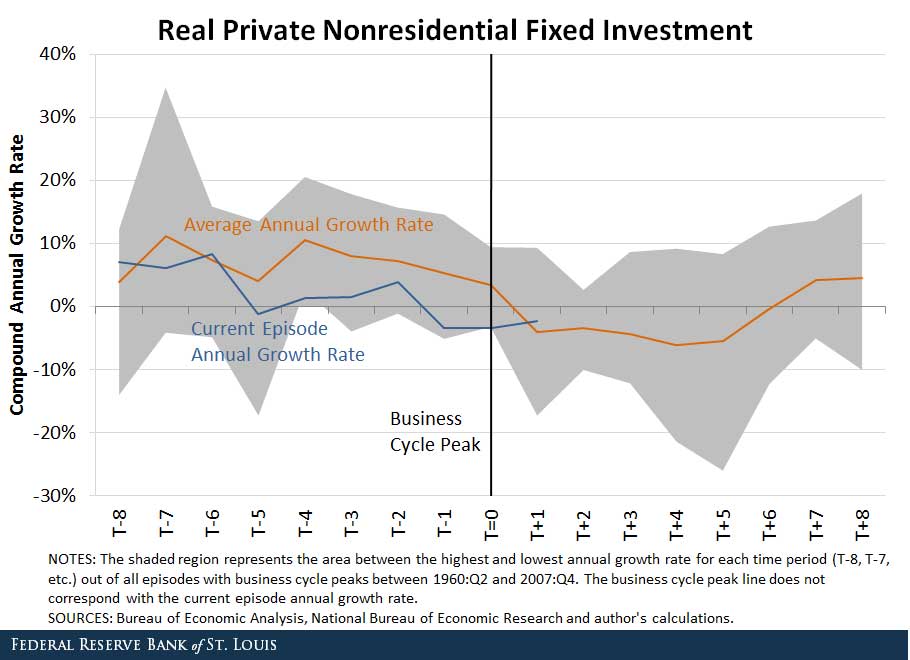
The cyclical indicator properties of each fixed investment series is seen in the figures. On the business side, the growth of real NRFI tends to be positive until the peak, but then growth turns negative, on average, for six consecutive quarters.
On the housing side, the growth of real RFI, on average, turns negative two quarters before the business cycle peak. The growth of real RFI then remains negative during the first two quarters of the recession. But as the shaded areas indicate, there are exceptions to this pattern for both series.
Recession Looming?
Are current fixed investment developments worrisome from an historical standpoint? Two points are worth noting. First, the recent pattern of negative real NRFI growth is somewhat different than the pattern typically seen prior to a business cycle peak. On average, negative NRFI growth is associated with negative real GDP growth for more than one quarter, and we have yet to see that in the current expansion. Subsequent revisions may show that the economy entered into a recession during the fourth quarter of 2015 or the first quarter of 2016, when real GDP growth was less than 1 percent, but that seems unlikely given the economic strength in other areas – especially labor markets.
Second, the decline in real RFI would be consistent with previous prerecession patterns if the U.S. economy was nearing a tipping point in the expansion. Recall that the message from the above figure was that housing usually leads the economy into the recession, posting negative growth rates six months before the peak.
At this point, the majority of industry analysts and professional forecasters remain optimistic about the housing sector over the remainder of 2016 and into 2017. Key positive developments in this regard include expectations of continued strength in labor markets, low mortgage interest rates and relatively high levels of housing affordability.
Conclusion
To sum up, the declines in residential and nonresidential fixed investment are worrying because they are often viewed as reliable leading indicators of the cyclical strength or weakness of the economy. Although economists and other economic analysts find it very difficult – if not impossible – to predict recessions in real time, the available evidence suggests that the economy, though exhibiting stubbornly weak real GDP growth, continued to expand heading into the second half of 2016.
Notes and References
1 Unless noted otherwise, growth rates are expressed at compounded annual rates using seasonally adjusted data.
2 Consensus forecasts for key economic data can be found on the Calendar of Releases cover page of the Federal Reserve Bank of St. Louis’ U.S. Financial Data.
3 Over the past four quarters, the decline in business inventory investment has subtracted 0.6 percentage points from real GDP growth. In the national accounts, final sales is the measure of GDP that removes the contributions to growth from changes in inventory investment. Thus, while growth is measurably stronger according to real final sales, the pattern of final sales growth has also shown the sharp deceleration noted in the figure for real GDP.
4 See Bullard, James. “The St. Louis Fed’s New Characterization of the Outlook for the U.S. Economy,” Federal Reserve Bank of St. Louis, June 17, 2016.
Additional Resources
From the President: The St. Louis Fed’s New Characterization of the Outlook for the U.S. Economy
On the Economy: How Successful Is the Fed at Controlling Interest Rates?
Source
https://www.stlouisfed.org/on-the-economy/2016/august/are-key-investment-indicators-signaling-recession
Disclaimer
Views expressed are not necessarily those of the Federal Reserve Bank of St. Louis or of the Federal Reserve System.


