


by St Louis Fed
— this post authored by Alejandro Badel and Joseph McGillicuddy
Between January 2011 and June 2014, Brent crude oil prices fluctuated around an average price level of $110 per barrel. Between June 2014 and January 2015, oil prices dropped precipitously, stabilizing at about $55 per barrel. This pattern was accompanied by a reduction in breakeven inflation expectations, which, in the case of the five-year forward rate, dropped from 2 percent at the end of June 2014 to 1.30 percent at the beginning of January 2015.[1] Since then, the five-year breakeven inflation rate has increased steadily, reaching 1.72 percent by the end of April.

Figure 1 displays the five-year forward breakeven inflation expectations measure and the log of the real price of crude oil.[2] The figure 1 suggests the existence of two distinct trends. First, up to the financial crisis in 2008, we observe a gradual increase in oil prices without large changes in breakeven inflation expectations. Second, since the financial crisis, the two series seem to move in tandem. In fact, the correlation of the two series up to December 2007 was 0.54, while it was 0.75 afterward.[3] Also, the figure suggests a break in the mean level of inflation expectations, which falls from about 2.28 percent before the financial crisis to roughly 1.79 percent afterward. It is interesting to note that the correlation between the two variables from January 2003 to April 2015 is only 0.13. The contrast between this low correlation and the high correlation found in the two subperiods discussed above is likely explained by the break in the mean of inflation expectations.
In the remainder of this article, we make an initial attempt to uncover the sources of the correlation between breakeven inflation expectations and oil prices. We do so in two steps. First, we revisit a method to break up oil price movements into three components. Second, we evaluate the correlation of each of these components with breakeven inflation rates.
Changes in Oil Prices
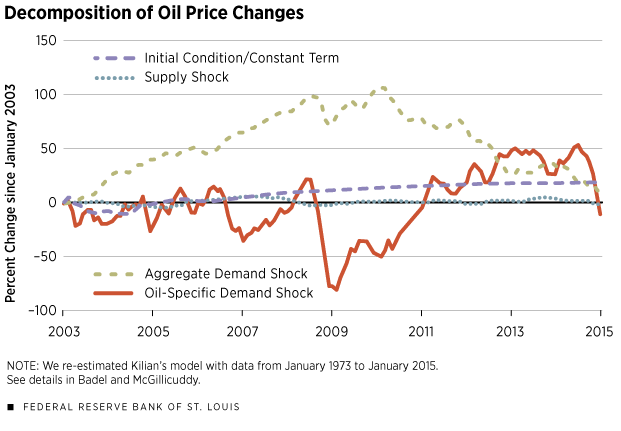
We replicated a leading analysis of the shocks affecting oil prices found in a 2009 paper by economist Lutz Kilian. Changes in oil prices are broken down into three sources: (1) “supply shocks,” which are unpredictable changes in crude oil production, (2) “aggregate demand shocks,” which are unpredictable changes in real economic activity that cannot be explained by crude oil supply shocks, and (3) “oil-specific demand shocks,” which are innovations to the real price of oil that cannot be explained by oil supply shocks or aggregate demand shocks.
The oil-specific demand shock can be interpreted as the change in the demand for oil driven by precautionary motives. According to Kilian, concerns over unexpected growth of demand and/or unexpected declines in supply can lead to higher demand for oil inventories, which can serve as insurance. Mechanically, however, this shock is calculated as a remainder – innovations to oil prices that cannot be explained by changes in global economic activity or changes in oil production. Details of the data and the methodology are provided in Badel and McGillicuddy.
Figure 2 displays the cumulative contribution of each of the shocks and initial conditions to the cumulative change in the natural log of oil prices starting in January 2003.
Inflation and Oil Price Correlation
We calculated the correlation between breakeven inflation expectations and each of the components of log oil prices displayed in Figure 2. The “All” column of the table displays the correlation between breakeven inflation expectations and log oil-price changes since 2003 (i.e., the sum of all components in Figure 2). The next three columns break up this correlation into separate components corresponding to each shock.
Correlation with Breakeven Inflation Expectations
| Years | All | Supply | Aggregate Demand | Oil-Specific Demand |
| 2003-2007 | 0.543 | – 0.105 | 0.542 | 0.256 |
| 2008-2015 | 0.798 | 0.396 | – 0.142 | 0.618 |
| 2014-2015 | 0.924 | 0.783 | 0.646 | 0.879 |
SOURCE: Authors’ calculations.
The “All” column shows that the correlation of breakeven inflation expectations with oil prices is higher in more recent subperiods. This has been accompanied by a tighter synchronization of all sources of oil price movements and inflation expectations. The “Supply” and “Aggregate Demand” columns show how the correlation for both supply factors and aggregate demand factors is positive in the 2014-2015 period but not in all previous subperiods.
We draw two conclusions: First, Figure 1 shows that the average level of inflation expectations seems to have decreased after the financial crisis. The fact that the correlation between inflation expectations and oil price was low when measured over the full 2003-2015 period but high in the three subperiods identified in the table suggests that the level shift in inflation expectations after the financial crisis is unrelated to oil price shocks.
Second, only the correlation of oil-specific demand shocks and inflation expectations is large and positive across all subperiods considered in the table. This contrasts with the behavior of the other two correlations. Further, this correlation has increased in recent subperiods. The table, thus, suggests the need to further investigate the nature of oil-specific demand shocks.[4]
Figure 1

Figure 2
Endnotes
- Breakeven inflation expectations are defined as the difference between the yield provided by nominal government debt and the yield provided by inflation-indexed debt with the same time to maturity. For example, the U.S. five-year breakeven inflation rate is calculated as the yield on five-year nominal Treasury bonds less the yield on five-year Treasury Inflation-Protected Securities.
- U.S. refiner acquisition cost of imported crude oil, deflated by U.S. CPI.
- Correlation, here referring to the correlation coefficient, is a measure of the linear relationship between two variables and takes on a value between – 1 and 1. A positive value indicates that the two variables tend to move together, while a negative value indicates that they tend to move in opposite directions. The farther away the value is from 0, the stronger the relationship, with +/ – 1 representing a perfect correlation, meaning if there is a change in one variable, the other is changed in a fixed proportion.
- See Baumeister and Kilian for a four-variable model with explicit treatment of oil inventories.
References
Badel, Alejandro; and McGillicuddy, Joseph. “Oil Prices: Is Supply or Demand behind the Slump?” On the Economy (blog), Federal Reserve Bank of St. Louis, Jan. 13, 2015. See www.stlouisfed.org/on-the-economy/2015/january/oil-prices-is-supply-or-demand-behind-the-slump.
Baumeister, Christiane; and Kilian, Lutz. “Understanding the Decline in the Price of Oil since June 2014.” Working Paper Series, No. 501, Center for Financial Studies, Jan. 24, 2015. Seehttp://econstor.eu/bitstream/10419/106822/1/816879087.pdf.
Kilian, Lutz. “Not All Oil Price Shocks Are Alike: Disentangling Demand and Supply Shocks in the Crude Oil Market.” American Economic Review, June 2009, Vol. 99, No. 3, pp. 1,053-69. Seehttp://pubs.aeaweb.org/doi/pdfplus/10.1257/aer.99.3.1053.
>>>>> Scroll down to view and make comments


