Written by Lance Roberts, Clarity Financial
Data Analysis Of The Market and Sectors For Traders

Please share this article – Go to very top of page, right hand side, for social media buttons.
S&P 500 Tear Sheet
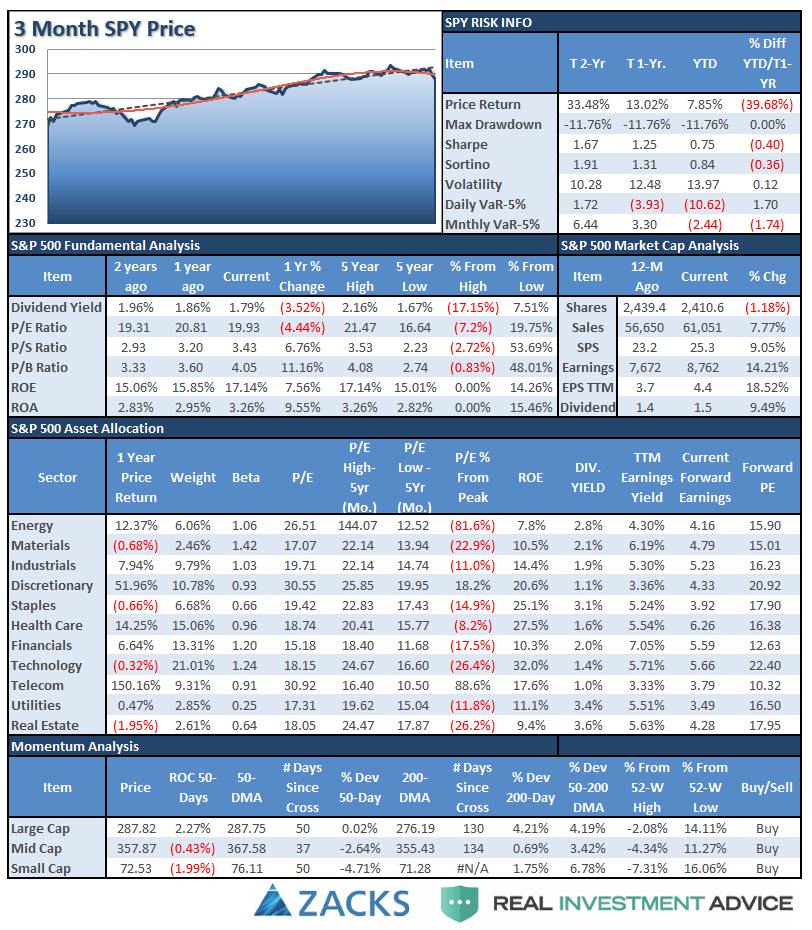
Performance Analysis
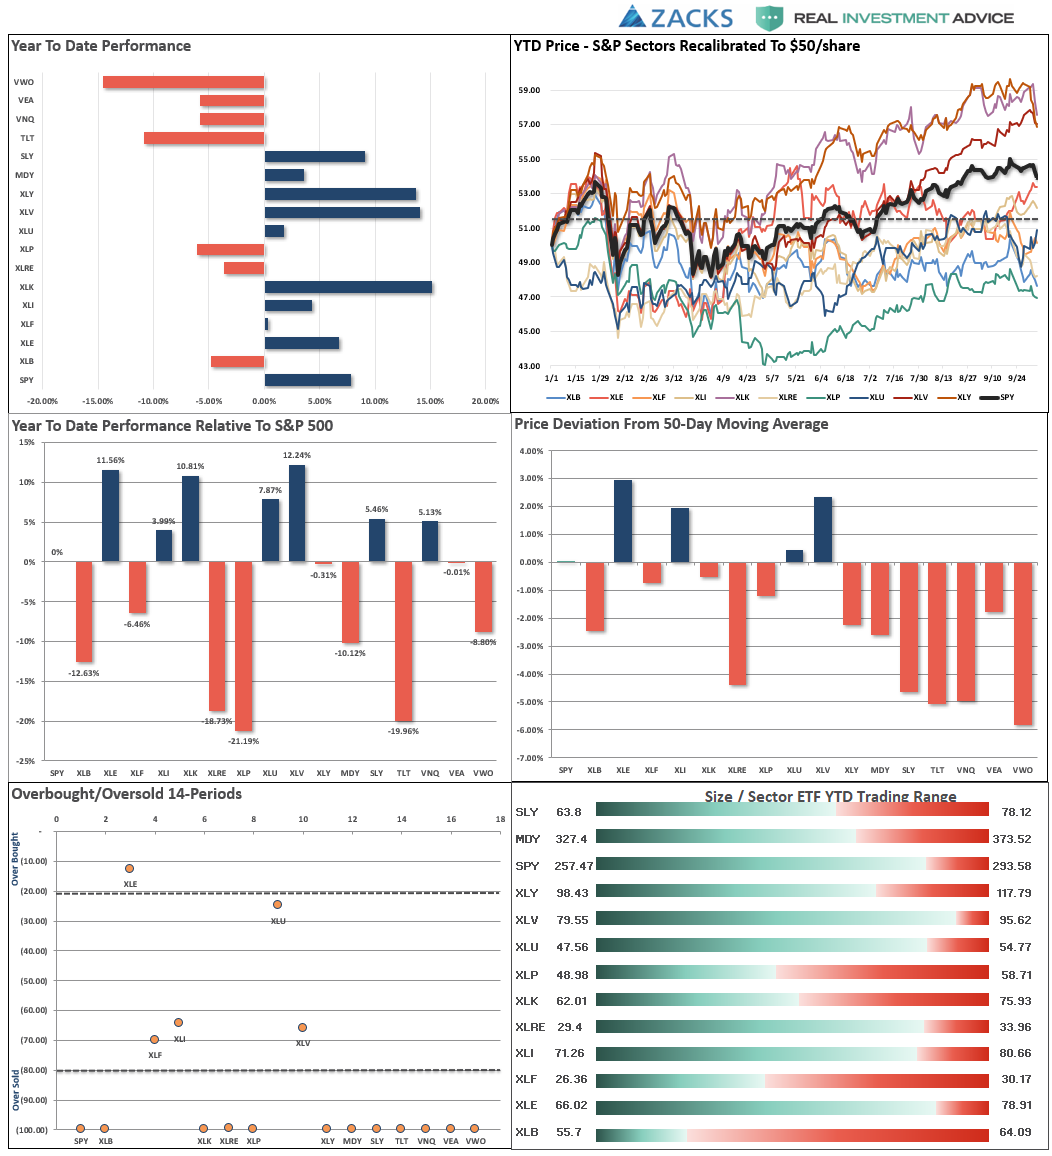
ETF Model Relative Performance Analysis

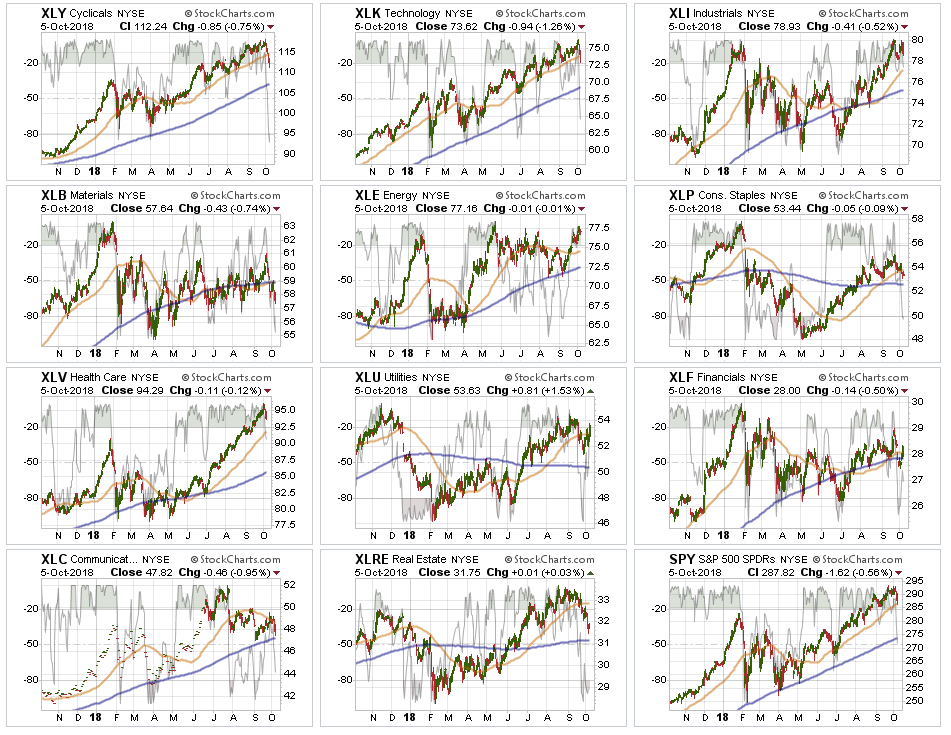
Sector & Market Analysis:
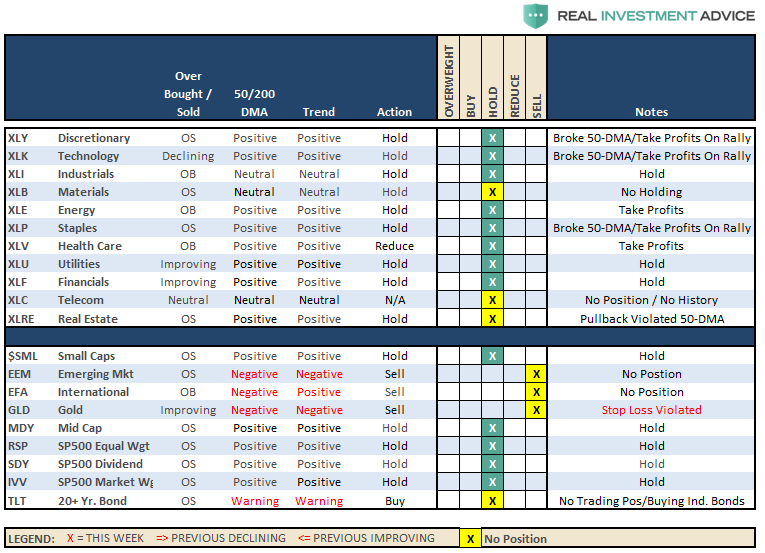
As I noted, the S&P 500 sectors have been shuffled up a bit. As such, I have changed the two charts below. The S&P analysis now includes both XLC and XLRE. I have also added the S&P 500 index just for comparative purposes.
Since real estate was moved up from the major markets graph, I have added a pure S&P 500 index for comparative performance to the equal weight and dividend weighted indices.
Sector-by-Sector

Industrials, Energy, Utilities, and Financials we the stronger performers last week as money rotated out of more consumer-oriented sectors which will likely be impacted by higher interest rates. While the sectors remain short-term bullish, money is rotating very rapidly through the market currently so some caution is advised.
Discretionary, Staples, and Materials violated their 50-dma last week. Materials remain in a bearish trend currently. With discretionary and staples getting oversold, look for a bounce next week to rebalance risks into.
Real Estate because of the rise of interest rates has been under pressure as of late. Look for support at the 200-dma. If rates fall back below 3% in the next week or two, there should be a very tradeable opportunity for REIT’s in the short-term given the very oversold condition. The recent recommendation to take profits was timely.
Energy – The uptick in oil prices over the last couple of weeks brought money flows back into the Energy sector which has rallied and is currently flirting with a “double top.” Stops should remain at the 200-dma.
Financials continue to languish. The only good news here currently is that after falling apart previously, the past weeks the sector rallied but failed at the 50-dma. Move stops up to the recent lows, and watch the 200-dma as important support.
Telecommunications – with the new reshuffle in this sector could well see a pick up in volatility. There is no reason to add this sector to holdings right now as there simply isn’t enough data yet to determine much of anything from a trading perspective. We will watch this over the next couple of months to see how things develop.

Small-Cap and Mid Cap – we noted five weeks ago that these markets were extremely overbought and extended, and a pullback to support was needed. The advice to take profits in these sectors was prescient with both sectors violating their respective 50-dma’s in the recent sell-off. Mid and Small-caps are now very oversold so look for a failed rally back to the 50-dma’s to reduce risk in portfolios.
Emerging and International Markets as I noted last week.
“Both sectors rallied a bit last week, providing an opportunity to reduce exposure for the time being and reallocate that capital to better performing areas. WHEN international and emerging markets begin to perform more positively we will add positions back to portfolios. There is just no reason to do so now.”
That advice remains the same this week. With 0 and 1 trend and momentum indicators in place, there is no reason to be long these sectors just yet. If we start to see real improvement, versus a bounce in a downtrend, we will reconsider our weightings.
Dividends, Market, and Equal Weight – we added a pure S&P 500 index fund to our “core” holdings which will add some beta to the portfolio but acts as a placeholder for sectors and markets we have no allocation to (ie, international markets, gold, basic materials.) We continue to hold our allocations to these “core holdings” and continue to build around these core with tactical positions that provided opportunistic advantages.
Gold – failed, again, at the 50-dma this past week. This was your opportunity to sell your holdings for the time being. Stops remain firm at $111 again this week which looks like they may well be triggered next week. Gold currently has 0 of 10 trend and momentum indicators in place.
Bonds – broke their near-term support at $114 triggering the stop loss on trading positions. However, we are now aggressively buying individual bonds at depressed prices and increasing yield in portfolios. All trading positions are currently closed.
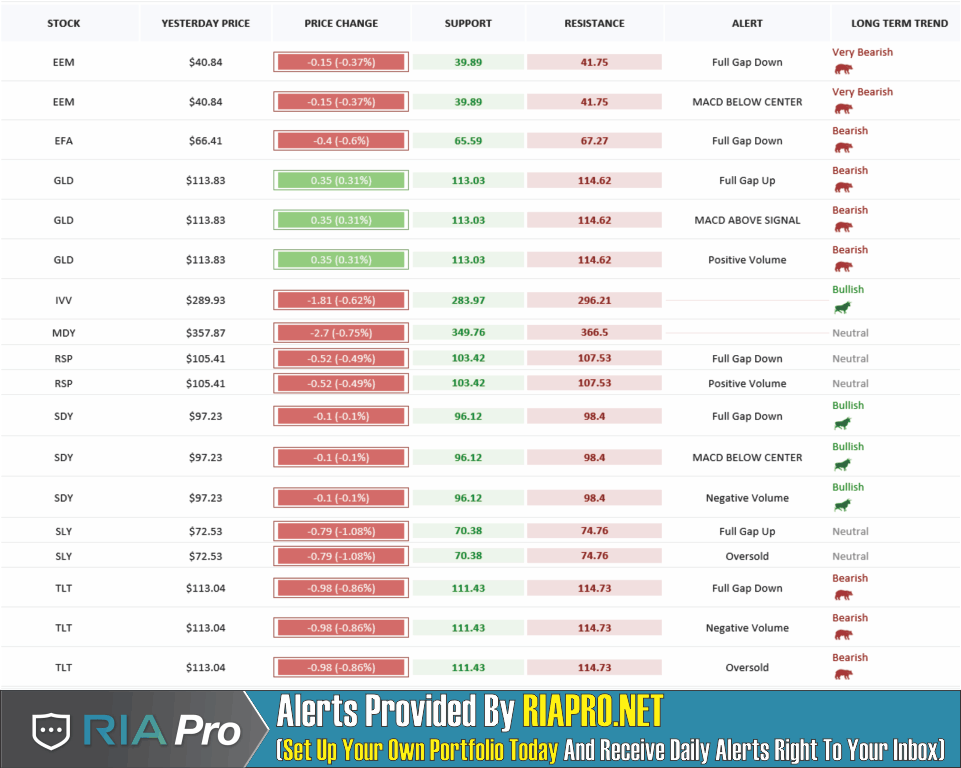
The table below shows thoughts on specific actions related to the current market environment.
(These are not recommendations or solicitations to take any action. This is for informational purposes only related to market extremes and contrarian positioning within portfolios. Use at your own risk and peril.)
Portfolio/Client Update:
As noted, several weeks ago, with the market holding support above the “breakout” levels from January, we added exposure to portfolios. With the pullback to that breakout level this past week we will wait to see if these levels hold.
The bad news is that the rotation between sectors and markets has deteriorated in recent days, so we are becoming a bit more cautious in the short-term. However, our view that we will likely see and end-of-year push still remains intact. For now.
Currently, with portfolios fully allocated there is little to do this next week. However, we will be monitoring things closely.
- New clients: We are watching the current pullback to hold support to on-board new positions.
- Equity Model: Semiconductors (MU & KLAC) remain on “Sell Alerts” – we are monitoring these positions closely and stop-loss levels have been tightened up. If the market sells off more this coming week we will likely get stopped out of several positions which will raise our cash levels and hedge portfolio risk.
- Equity/ETF blended – Same as with the equity model.
- ETF Model: We overweighted the core “domestic” indices by adding a pure S&P 500 index ETF to offset lack of international exposure. We remain overweight outperforming sectors to offset underweights in under-performing sectors. We will likely reduce small and mid-cap holdings on a rally to the 50-dma.
- Option-Wrapped Equity Model – If the market rallies, and fails to obtain a new high, we will add a long-date S&P 5oo put option to portfolios to hedge risk.
There were no changes last week as the bulk of our positions are currently working as expected. However, as we have repeatedly stated, we are well aware of the present risk. As noted, stop loss levels have been moved up to recent lows and we continue to monitor developments on a daily basis. With the trend of the market positive, we want to continue to participate to book in performance now for a “rainy day” later.
It is important to understand that when we add to our equity allocations, ALL purchases are initially “trades” that can, and will, be closed out quickly if they fail to work as anticipated. This is why we “step” into positions initially. Once a “trade” begins to work as anticipated, it is then brought to the appropriate portfolio weight and becomes a long-term investment. We will unwind these actions either by reducing, selling, or hedging, if the market environment changes for the worse.


